Customer success metrics are strange creatures—
For example, it would seem that a +100 value in the net promoter score dimension is rather healthy.
But what if I told you the company it comes from… has had only two customers in the last year and their lifetime value is 10 dollars each?
Here’s the thing:
To understand how your business is doing you must look at it from various perspectives and measure the right things. Otherwise, you’ll drown in a sea of meaningless numbers.
Don’t worry, though.
If you first need to brush up on your general understanding of customer success, head straight to our guide on customer success that includes definitions, importance, and more.
In short, customer success KPIs are the numbers you can track to see how effective your organization is in implementing strategies. You can also use customer success metrics to ensure that you’re helping consumers achieve their desired goals.
Let’s admit it—
Customer metrics are at the heart of every successful business because when you use them well, you can measure performance and plan goals more efficiently.
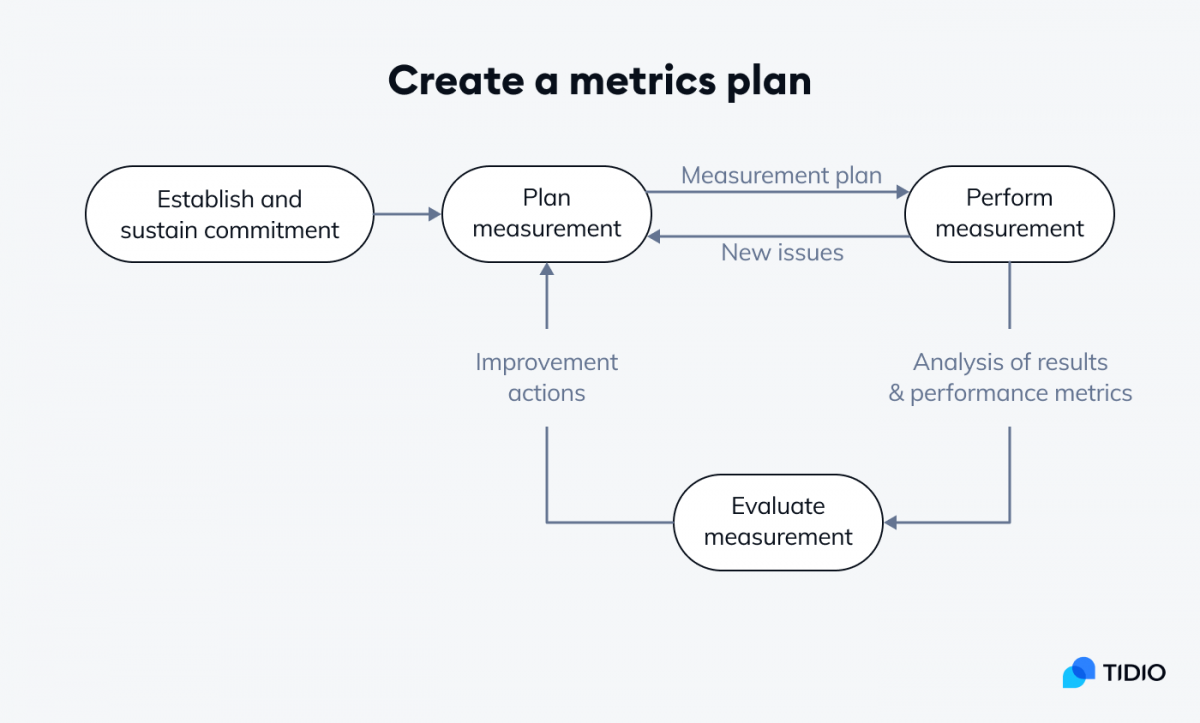
But first, you need to plan which ones to use. When you have that plan drafted, you should test the measurements to find issues. Then, analyze, evaluate, and improve your plan to ensure your metrics work well for you and are effective. Over and over again until your metrics plan works smoothly for your organization.
The list below includes the most important success metrics examples. It isn’t exhaustive, but it’s a good starting point for your brand to become data-informed.
Download the spreadsheet template below to keep track of your customer relationship metrics easier and more efficiently. Every customer success KPI from this article is there, and you can easily adjust the template to your needs.
1. Net Promoter Score (NPS)
Net Promoter Score shows you how loyal your clients are, which ones are your fans/promoters, and which ones drive people away from your brand.
How to measure the net promoter score?
Start with an NPS survey consisting of just one question: “How likely are you to recommend X to a friend or family?”
The client can answer on a scale of 0-10 how likely they are to recommend your business to their close ones:
- Scores of 0-6 are the detractors—the unhappy consumers who are likely to discourage others from buying from you
- The score of 7-8 are passives—they are satisfied with your service but not enough to promote you
- The score of 9-10 are promoters—loyal and enthusiastic about your products and services, they will recommend you to others
Learn how to improve customer success using AI
The score can range between -100 to +100, and the higher the number, the better for your company. The more likely the customers are to recommend you, the more loyal they are to your brand, and the more clients you’ll gain from them.
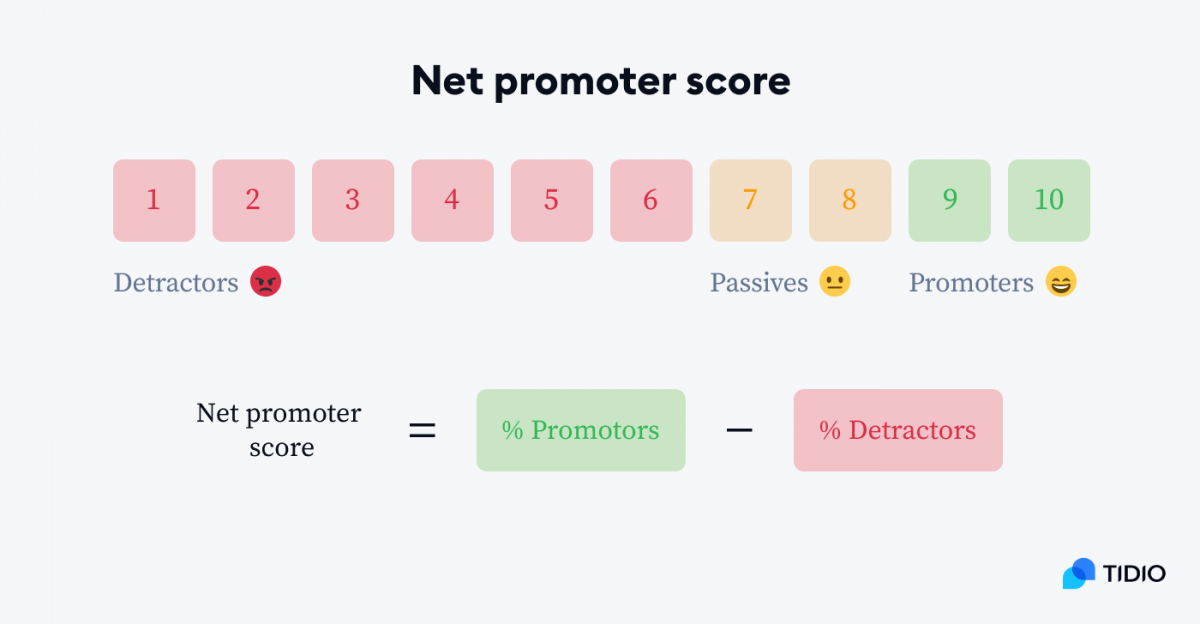
For example, if 20% of your clients are unhappy with your services, 10% are neutral, and 70% are your fans, your score would be 50%. This means 50% more of your consumers recommend you than detract from you.
Why you should use an NPS score
This customer success metric can help you incorporate consumer feedback into your company’s strategy. It is easy to calculate, and it can help you see how happy your clients are with you.
This, in turn, can help you assess the health of your company as a whole.
One of the best ways to measure customer success is to evaluate how many other people the customers have recommended your brand to. Hence, the importance of continuously measuring the Net Promoter Score (NPS).

You can use the net promoter score to measure client satisfaction, their loyalty, and how likely they are to recommend you. But this measurement is not limited to clients. You can also use it to see how happy your employees are with your organization.
Benchmark for the net promoter score
To understand this customer success KPI better, you can benchmark it against the average NPS in your industry:
- NPS for software companies is 41 varying from 28 to 55
- Retailers benchmark lands on 35, with the low of 1 and high of 59
- Auto dealers have an NPS benchmark set at 48, between the scores of 33 and 63
Check out this short video from Bain & Company about NPS:
2. Customer Lifetime Value (CLV)
This is one of the customer success manager’s metrics.
It shows you a prediction of how much an average consumer will spend on your products and services over their entire relationship with your organization.
How to calculate CLV?
To calculate your customer lifetime value:
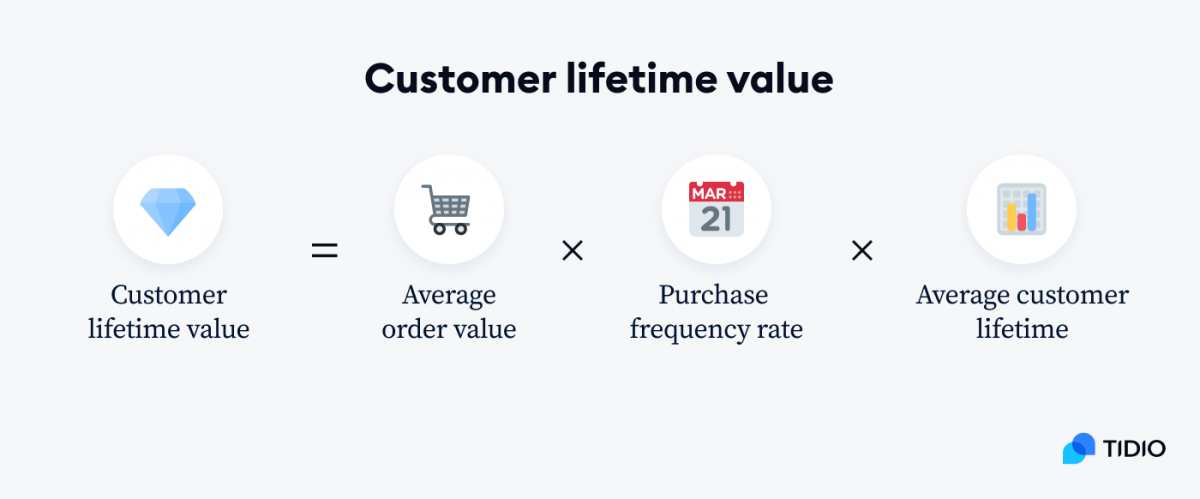
- First, take your total revenue and divide it by the number of buys. That’s your average order value (often abbreviated to AOV).
- Next, divide the total number of buys by the total number of unique customers. That’s your purchase frequency rate.
- Lastly, the average customer lifetime is the number of days between the first and last order date, divided by 365 (to convert into years).
- To finish off, multiply these numbers.
You might have heard that you should subtract acquisition costs before reporting your CLV.
You shouldn’t.
Acquisition costs are important and should affect the decisions whether or not to pursue prospective customers. But the CLV is the lifetime value of customers that your brand already acquired so you don’t need to account for it again.
Learn more about why you shouldn’t subtract the acquisition costs when reporting the CLV.
Why is customer lifetime value important?
This client success metric is important because it helps you improve your understanding of your clients, which is also confirmed by academic research.
The CLV can also help you with measuring customer engagement, improving customer retention, and segmentation strategies. Once you know what each customer’s lifetime value is, you’ll be able to group them accordingly.
Customer lifetime value metrics can also help you target your marketing efforts more effectively and customize them for each client group.
Customer lifetime value benchmark
A report by RJMetrics shows that an eCommerce store’s average customer lifetime value in the top-performing companies is $3,600, and in the bottom-performing companies, it’s between $460-$770.
So, a good benchmark for you would be between $460 and $3,600, aiming for the higher one. Of course.
You are one step closer to learning your customer lifecycle. If you want more information about customer lifetime value, its benefits, and examples, check out this article.
3. Customer Acquisition Cost (CAC)
Track customer acquisition cost (CAC) not to let your spendings spin out of control.
This important customer success metric shows you how much it costs you to acquire a new client.
How to calculate CAC?
You can measure your customer acquisition costs by:
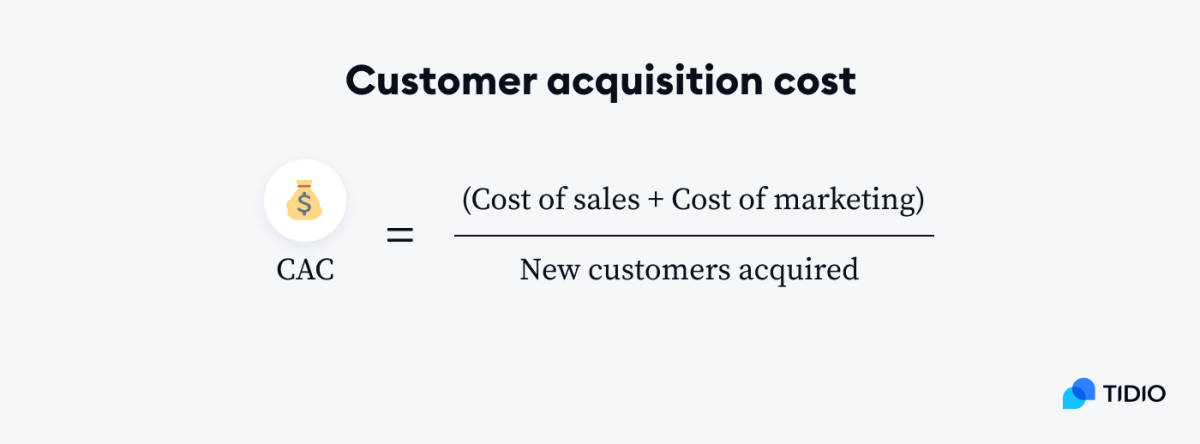
- Adding the cost of sales and the cost of marketing
- Then, dividing the sum by the number of new customers acquired
Why should you measure your acquisition costs?
CAC is worth measuring to keep your finances on track and make informed decisions about where to invest your money best.
After all, you need to be aware of how much each customer costs your business to know if you’re gaining any profit from them.
This customer success KPI works best when you use it alongside the customer lifetime value metric. You can then compare the two and see how much profit you get from each of your consumers.
So, if your CLV is around $1,000, then spending $100 on acquiring the client is okay. But if the lifetime value is only about $80, then you’re going to run dry quickly if you spend $100 on acquisition costs.
Benchmark for CAC
The average acquisition cost depends on whether we look at organic or inorganic acquisition. The benchmark for organic customer acquisition for SaaS companies in the U.S. is $205, but for inorganic acquisition, the cost rises to $341.
Check out this article for examples, best practices, and a deeper understanding of customer acquisition costs.
4. Churn Rate
First things first—
You should know that churn rate and customer attrition are synonyms of the same customer success metric. That’s why you might sometimes have seen them used interchangeably.
You can use churn metrics to see on average how many of your customers end their relationship with your brand.
When do you know a client churned?
Usually, you can classify clients as churned when they unsubscribe from your services or don’t purchase your products for a certain period. Business owners can decide on their own how long that period should be in their individual company.
To make it a little easier for you, check when a customer usually makes a repeat purchase from you. Let’s say a client usually buys from you every 90 days. In that case, you can mark every consumer who hasn’t purchased in that time as churned.
How to measure churn rate?
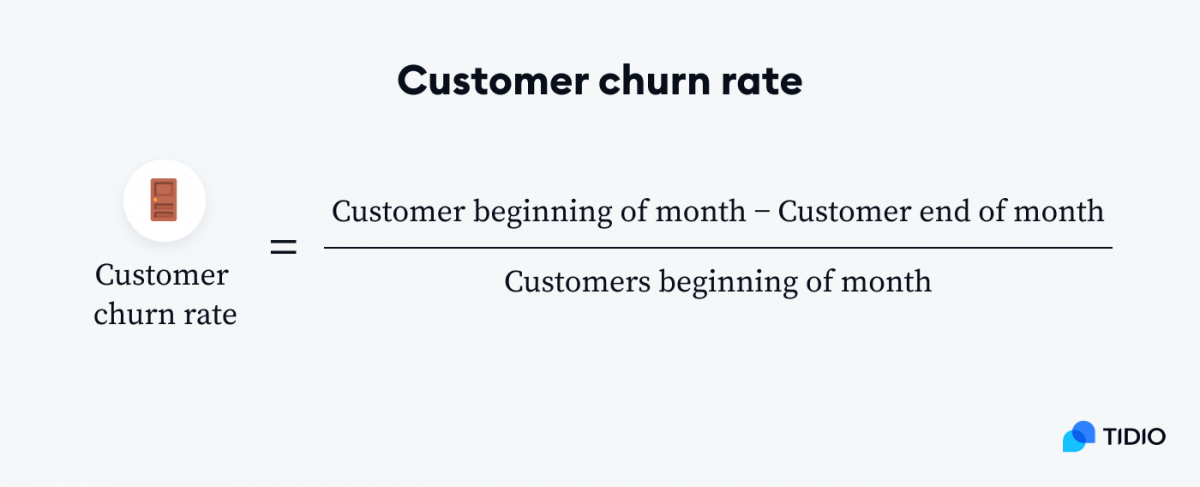
To calculate customer attrition rate:
- Subtract the number of clients at the beginning of a month from the number of clients at the end of it.
- Then divide the result by the number of customers at the beginning of the month.
Why should you care?
Because lost customers mean lost revenue.
If you can’t keep users, it can seriously affect your bottom line in the long run. But if you identify at what stage of the customer journey they churn, you can work on strategies that prevent it.
You should track this SaaS customer success metric to help you see the customer health score. It’s also important because the cost of acquiring a new client is 5-25 times higher than customer retention costs.
And if you lose clients, you’ll need to acquire new ones, which can prove costly in the long run.
The churn rate impacts other key customer success metrics and suppresses growth. Knowing this value can help you build more accurate forecasts for your business. It can also show how well your product is performing and what to expect in the future.
What causes churn?
One of the main reasons customers uninstall apps is because they don’t use them anymore. If you want to reduce your churn rate, make sure your products are updated and answer user needs.
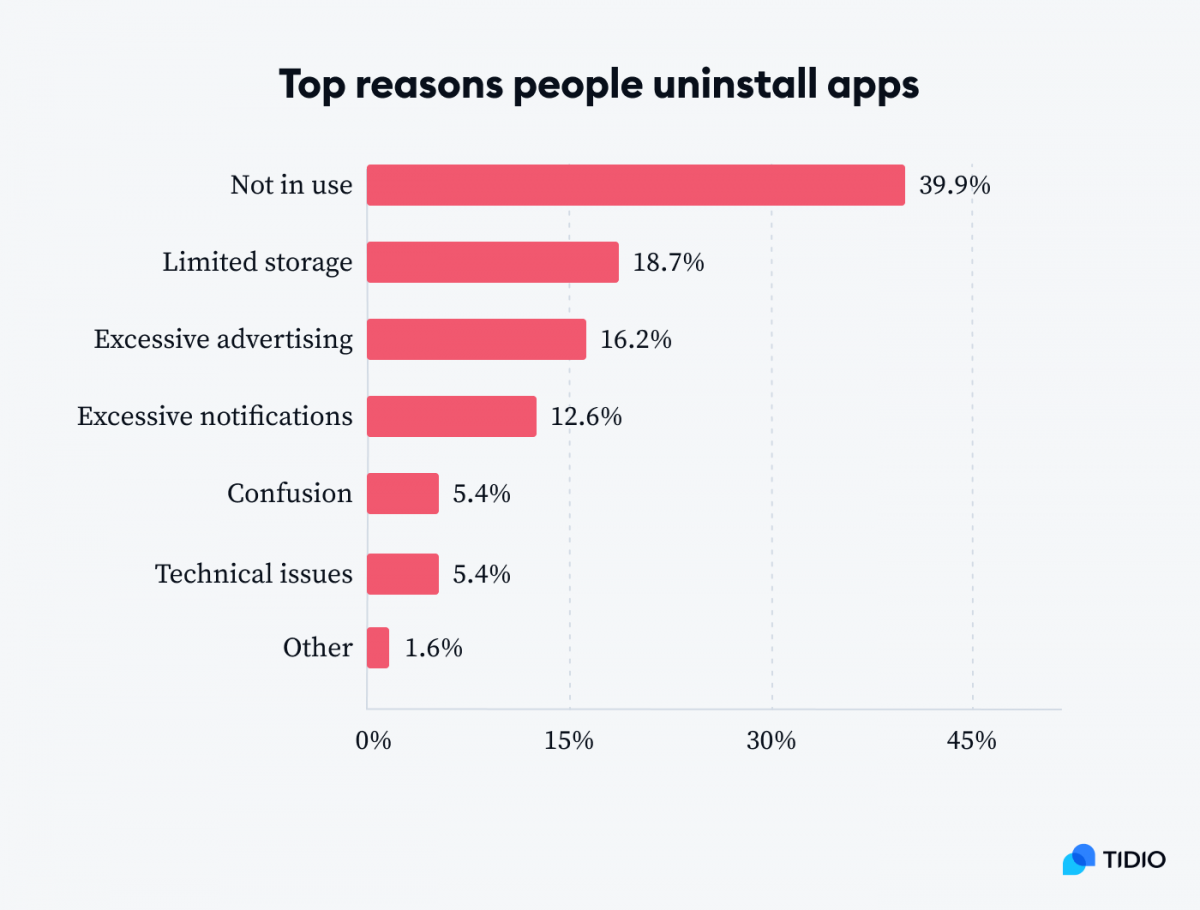
Research shows that reducing churn by 5% can increase your profit by as much as 25%. So ensure you’re conscious about this customer success metric to track during onboarding and throughout the shopper’s journey. Improve their experience and tweak your products according to the user’s needs.
Benchmark for customer churn rate
Typically a churn rate between 3-5% monthly is okay for SaaS companies targeting small businesses. If you have a media and entertainment company, 5.23% is the benchmark for your industry. And the average churn for the consumer services industry lands at 7.49%.
Aim for numbers lower than these, and you’ll see your brand growing in front of your eyes.
Check out this guide to churn rate to find out more about different formulas and how it affects other SaaS metrics.
5. Customer Satisfaction Score (CSAT)
There are different types of customers but do generally you know how satisfied they are with your organization?
Customer satisfaction score (CSAT) is one of the best customer success metrics to help you discover how happy your clients are right from their onboarding process. This way, you can put a number on your consumers’ satisfaction with your products and services.
Customer satisfaction is an area where AI customer success and customer service metrics overlap for the most part. CSAT score is usually the most popular KPI choice in both cases.
How to measure a customer satisfaction score?
To measure customer satisfaction score you need to start by creating a customer satisfaction survey with answers on a Likert scale. This scale is a numerical or verbal scale to measure the respondent’s opinion or perception. Most often the answers vary between five, seven, or nine-point agreement for a numerical scale or “strongly agree” to “strongly disagree” for a verbal scale.
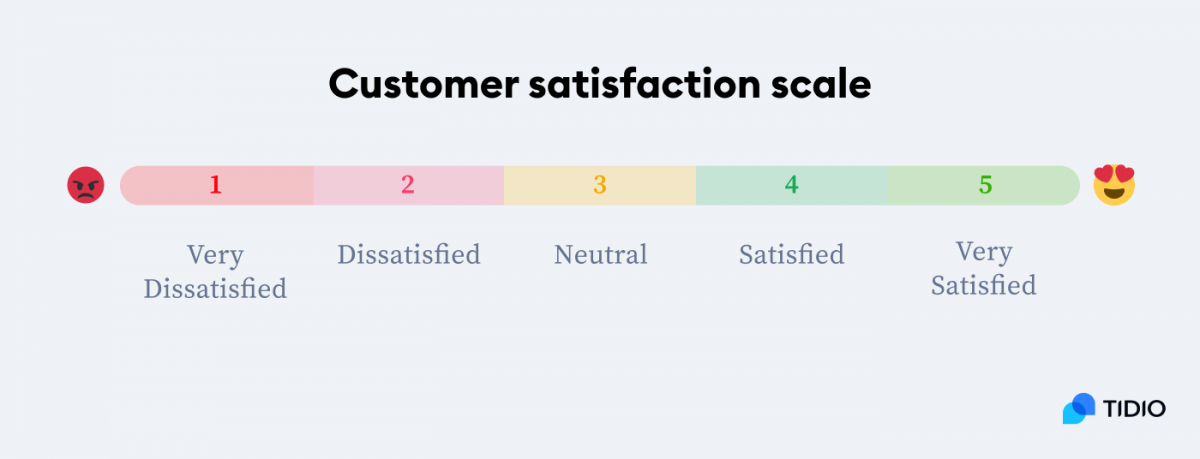
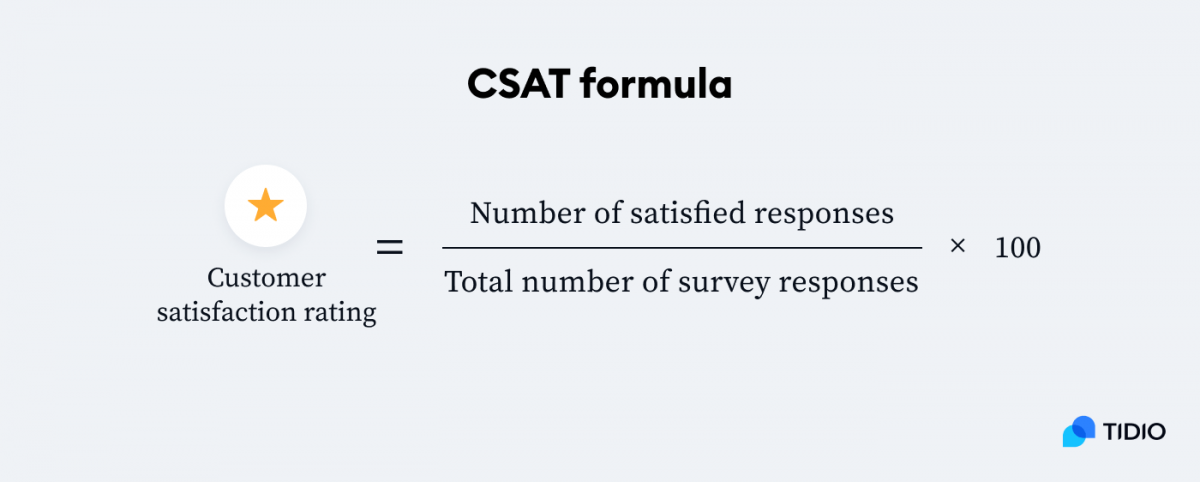
Then, divide the total number of satisfied responses by the total number of survey responses. In the case of a 1-7 scale, that would be the number of customers who answered 6-7.
To finish up, multiply that number by 100.
The CSAT formula looks like this:
Why does the CSAT matter?
This customer success metric can help you improve client experience and start inspiring brand loyalty. Plus, it is easy to understand, saves you time, and helps you examine specific interactions with clients.
If you don’t ask your consumers how satisfied they are with your products and services, you’ll start losing them. And you’ll have no real explanation for why they are leaving.
For example, if your satisfaction score is around 10%, you can ask for more information from your clients to find why they’re not happy with your product. Once they tell you what this is, you can start making amends.
Customer satisfaction score benchmark across industries
According to the American Customer Satisfaction Index, the benchmarks for customer satisfaction in 2021 were:
- Manufacturing/durable goods score the highest at 78.2
- Accommodation and food services score at about 77.6
- For transportation, the benchmark is 74.9
- About 72% of telecommunications and information customers are satisfied with their brand
Find out more about customer satisfaction with examples and ways to improve it.
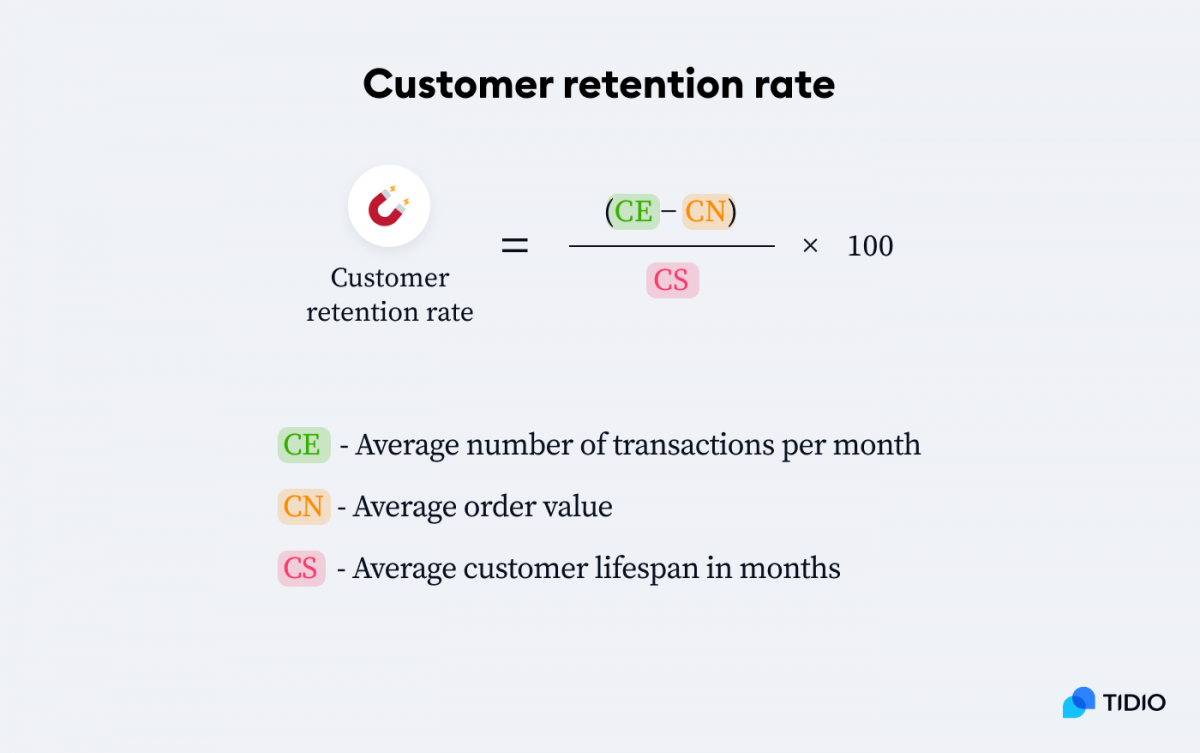
6. Customer Retention Rate
Thanks to this customer success metric, SaaS businesses know how many consumers stay for longer periods of time and not just a one-time purchase. You can pair it with your churn rate, and you’ll get a fuller picture of how many clients are leaving compared to those who are staying.
How do you calculate the customer retention rate?
To measure this customer success KPI:
- First, decide on a period you want to measure your customer retention rate (it can be a month, quarter, or 6-months).
- Subtract the number of customers at the end of the given month from the new ones you gained during that time
- Then divide that amount by the number of clients at the beginning of that month
- Finish your equation by multiplying the score by 100
This is how a formula for measuring customer retention looks like:
Read more: Discover the best SaaS help desk solutions that can help you retain more customers.
Importance of customer retention rate
Measuring customer retention can highlight issues you haven’t noticed and help you predict future revenue potential. These issues can include poor service quality and a lack of clients’ trust in your organization.
Once you know the percentage of your consumers that your company manages to retain, you can work on improving customer service and overall retention.
This SaaS customer success metric can also help you find how successful your brand is at satisfying existing shoppers. It can also help you boost loyalty, brand image and bring in new customers from referrals, contributing to the positive cycle of customer renewal and sustained business growth.
CRR benchmark
As with other metrics, the benchmark for customer retention varies by the industry:
- The highest retention rate goes to professional services with 84%
- IT Services are close behind at 81%
- Banking organizations retain about 75% of consumers
- Around 63% of retail clients are retained by the brands
Read more: Compare the best customer retention software available on the market and choose the right one for your business.
7. Monthly Recurring Revenue (MRR)
Monthly recurring revenue (MRR) is one of the most important customer success KPIs for businesses that have subscription-based revenue.
It shows you how much revenue your business generates each month from all active subscribers. This number accounts for all recurring charges generated by discounts, coupons, and add-ons. But it doesn’t include one-time fees.
You can tailor your business model with the use of this customer success metric. Focus on the relationship with subscribers and make them your priority because they are the ones who drive the subscription economy, not vendors.
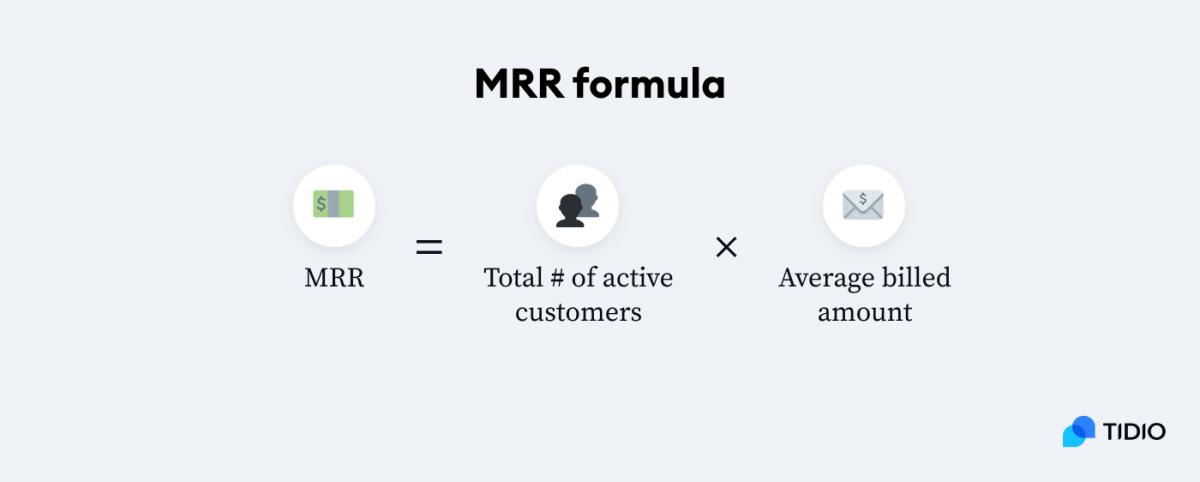
How to calculate the MRR of your company?
To measure your company’s monthly recurring revenue:
- Multiply the total number of active customers by the average amount billed to them.
Importance of MRR
You need to calculate this key customer success metric regularly to catch any downfalls and identify their causes. This way, no matter if it was a failed product, or bad customer service provided, you can fix the issue in a timely manner and prevent any further loss of clients.
It can help you rethink your business model towards what your subscribers want and need. You will see if the number of customers remains constant, grows, or dwindles month by month.
Benchmark for monthly recurring revenue
It’s impossible to tell the benchmark for MRR since every brand provides different products and services with different prices and a varied number of clients.
The benchmark for a good monthly recurring revenue growth is easier to find. This growth is the increase or decrease in monthly recurring revenue between one month and the next. The average for this growth is about 15% for a growing SaaS company.
Find out more about how to thrive in the subscription economy.
8. Average Time on a Platform
You can find the average time users spend on your website with this customer success KPI. It shows you how much time every visitor to your website stays on each page.
How to find the average time on the platform for your website?
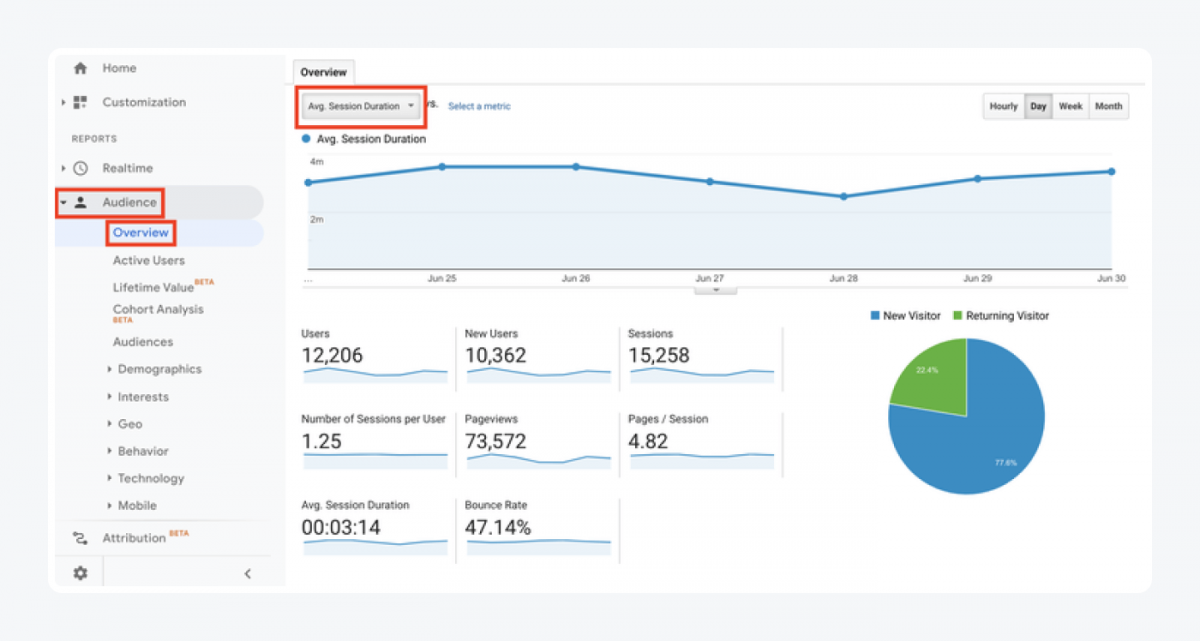
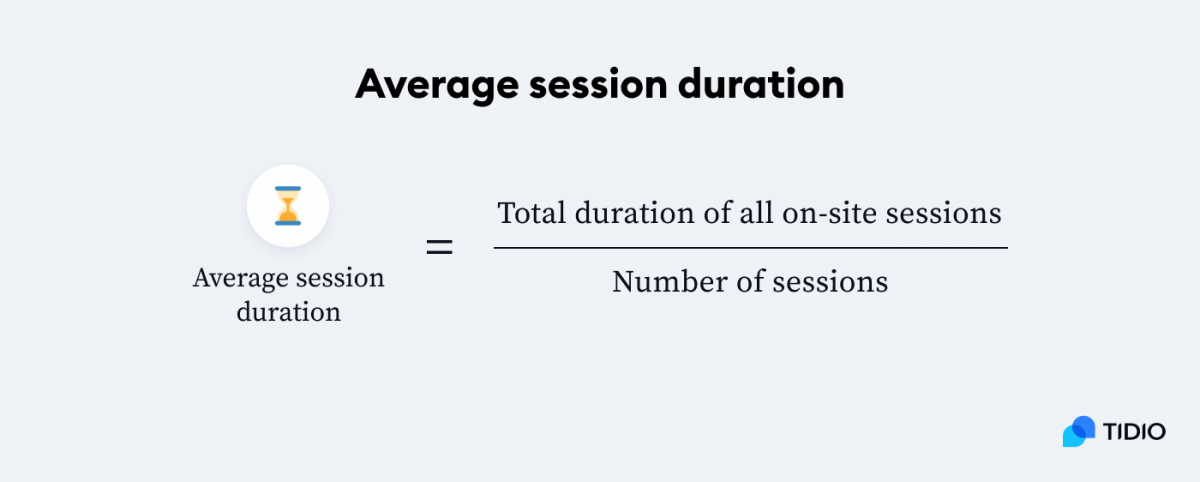
To find this customer success metric, SaaS companies can go to Google Analytics and choose the Audience tab. Then click the Avg. Session Duration from the dropdown tab. So, go on, open your Google Analytics, and follow along.
First, you’ll see a graph from which you can discover if the average time is rising or falling day by day or month by month.
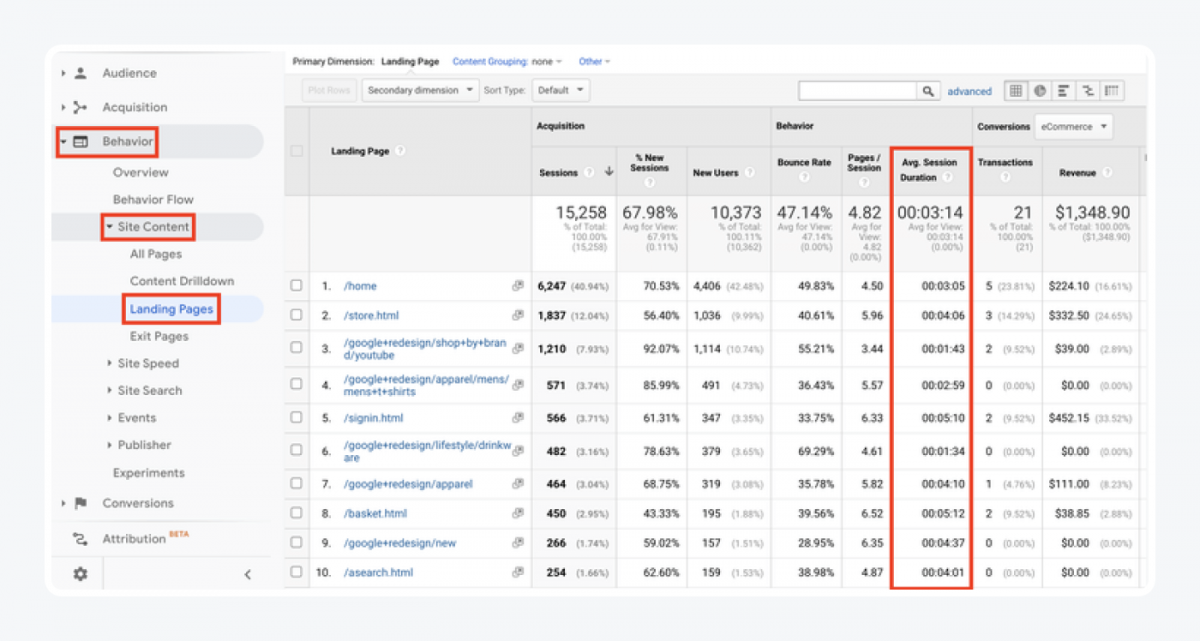
Another way to discover the average time on the platform from Google Analytics is to go onto the Behaviour tab. Then, choose Site Content and whichever pages you’re interested in. The average session duration should be your 8th column.
You can also calculate the average session duration with this formula:
Why track the average time on the platform?
Average time on a platform is an important customer success KPI to better understand how long users stay on your page. You can also see which pages are performing better or worse than others.
This can help you improve your SEO efforts and discover what you should focus your resources on. It can also help you compare different pages on your website, and by looking at the ones which perform better than others, you can pinpoint what to improve and how.
Benchmark to aim for
A reasonable benchmark for the average time on the platform is between 2-3 min. This might be tricky to measure due to the different pages each organization has, so it’s good to also look at your bounce rate.
Bounce rate is the percentage of visitors to your website who leave after looking at only one page. So, these are the people who don’t click through to any of your other pages once they see the initial page they clicked on.
A high bounce rate doesn’t need to be a bad thing. Don’t worry about it if your website’s goal is to increase the time visitors spend on your page and not to get multiple page views.
A report on digital experience benchmarks states that the average benchmark for bounce rate is 45% on desktops and 49% on mobile phones across all industries. So, if your bounce is somewhere in the area of these percentages, then you’re doing good.
It’s important to track your bounce rate along the average time on the platform to see the bigger picture of how your website is performing.
9. First Contact Resolution Rate (FCR)
The first contact resolution rate measures how many of your customers got their inquiries resolved during the first interaction with your brand. This is one of the most valuable customer success metrics to see the performance of your support team.
The resolution rate includes all customer support requests, such as calls, live chat, and social media, that your team managed to successfully resolve during the client’s first contact with the agent.
Inquiries are set as “resolved” when a representative takes the ticket and marks it as resolved after the interaction with the client. If the same issue doesn’t come up again from that consumer, then it is marked as being resolved at the first contact with your organization.
How to measure first contact resolution in your company?
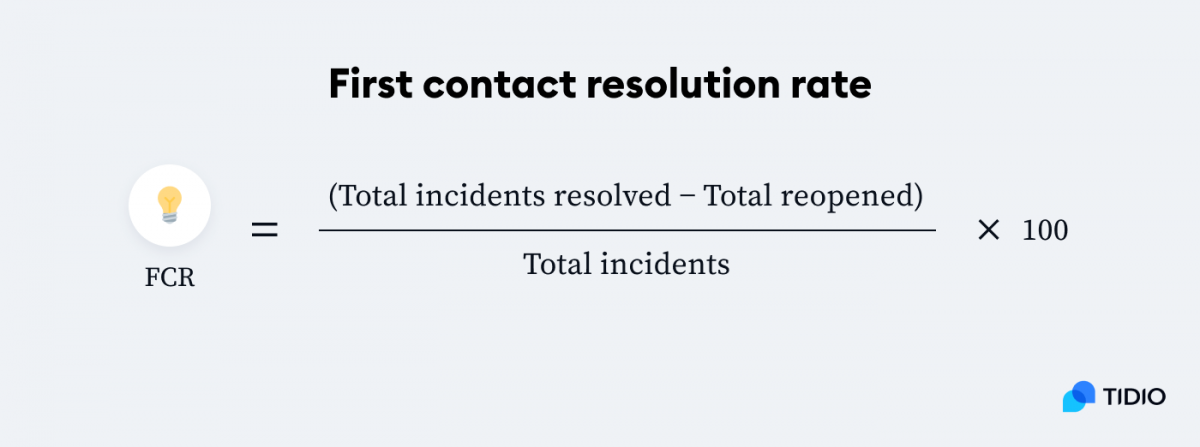
To calculate the first contact resolution rate:
- Subtract total issues reopened from the total incidents resolved
- Then, divide it by the total incidents
- End by multiplying the number by 100 to get the percentage of first contact resolutions
Why does the first contact resolution rate matter?
The FCR gives you insights into how customers perceive your organization and how effective your customer support team is in solving client’s issues. This customer success metric is also closely tied with customer satisfaction.
If your brand manages to resolve inquiries quickly, more of your consumers will be satisfied with your customer service. Simple as that. This can lead to improved customer loyalty and more retained clients, saving you money in the long run.
Let’s say there were 500 inquiries directed to your representatives last month, and they managed to resolve 480 of them, but 100 were reopened. That means your FCR is 76%. So your team resolved 76 out of every 100 issues, but 24 of your clients had to come back to have their problems solved.
Benchmark for FCR
The average first resolution rate ranges from about 41% to 94%. The worldwide average falls at around 74%. So, anything from 41% upwards would be an okay FCR to aim for depending on the services you provide and the difficulty of issues consumers have.
10. Free Trial Conversion Rate
There are three free-to-paid models in SaaS:
- Freemium—the product is free, but you pay for additional features and functionalities
- Free trial with the credit card
- Free trial without the credit card
This SaaS customer success KPI focuses on the last two and measures how many of your free trial visitors convert to being paying customers.
Free trial conversion rate calculation
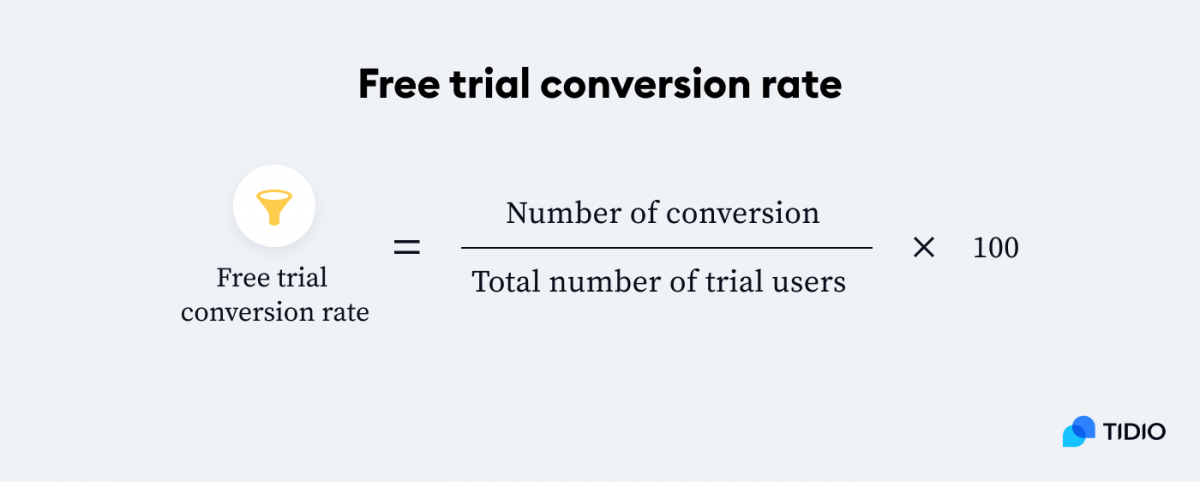
You can calculate the free trial conversion rate by:
- Dividing the number of conversions by the total number of trial users
- Then, multiply it by 100 to get the percentage of converted clients
Use this formula for an easier calculation:
Importance of the conversion rate
This is pretty straightforward. If shoppers don’t convert into paying customers, you won’t start profiting from them.
Also, the free trial conversion rate is an important customer success KPI because it can help you lower your acquisition costs by increasing the value of your current visitors and users.
Increasing the conversion rate will help you gain more revenue from existing users and grow your business down the line. You don’t need to spend any extra money on acquisition. You just need to make sure the customers stay with you after the free trial to start making a profit from them.
Free trial conversion rate benchmark
Benchmarks for conversion differ depending on the model you use. Free trial without providing any credit card information varies between 3% and 25%. But when you collect credit card details up-front, this number is higher and ranges from 30-50%.
11. Repeat Purchase Ratio
Another way to see if you have successful and happy customers is by looking at the frequency of their purchases expressed by the repeat purchase ratio.
This is one of the key success metrics examples that shows you how many of your clients shop in your store more than once. It helps you calculate the percentage of the current clients coming back to your store for more purchases.
How to measure repeat purchase ratio
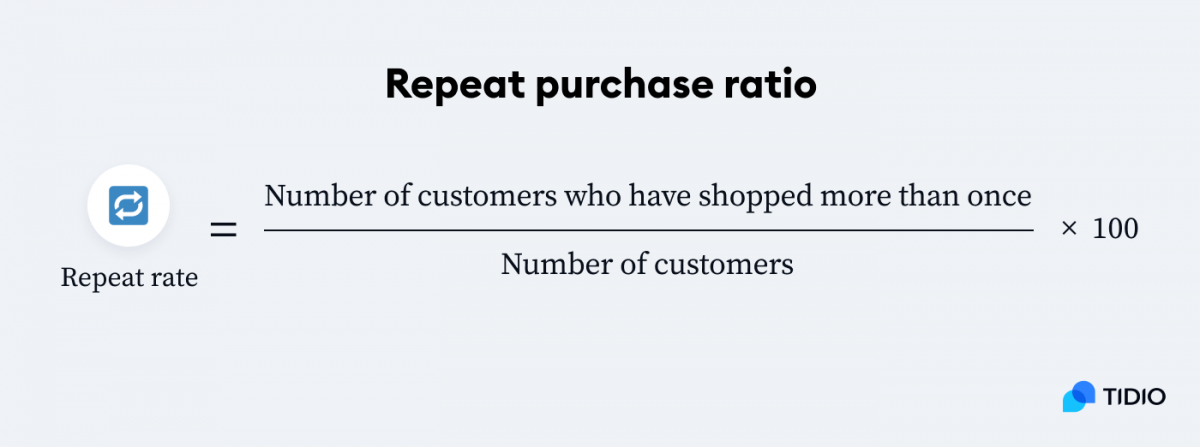
To calculate the repeat purchase ratio:
- Divide the number of customers who have shopped with you more than once by the total number of clients.
- Then multiply it by 100 to get the percentage of repeat customers.
Repeat purchase rate supplements your customer retention rate. It calculates the changes in the number of your clients within a shorter period of time to enable you to stay on track. This can help you improve the longer-term retention rate to make sure your clients stay with you for repeat purchases and longer time.
Why is repeat purchase rate important?
It shows if your customers are satisfied enough with the first product they purchased to continue returning to shop from your store.
It’s important to be aware of this customer success KPI to help you detect any issues with your onboarding process or customer service that might prevent buyers from repeat purchases. This way, you can tweak your strategy at the spot to fix any arising issues and put your efforts into inspiring loyalty and retention in your consumers.
Repeat purchase rate benchmark
A benchmark for repeat customer rate is between 20-30% for eCommerce businesses. Aim for this percentage, and your business is on a good way to thrive.
12. Customer Effort Score (CES)
How easy is it for your customers to get help from your business?
You can find that out with this customer success manager’s metric. It shows you how much effort it takes for your client to get their issue resolved, purchase a product, or get their question answered.
How to calculate a customer effort score?
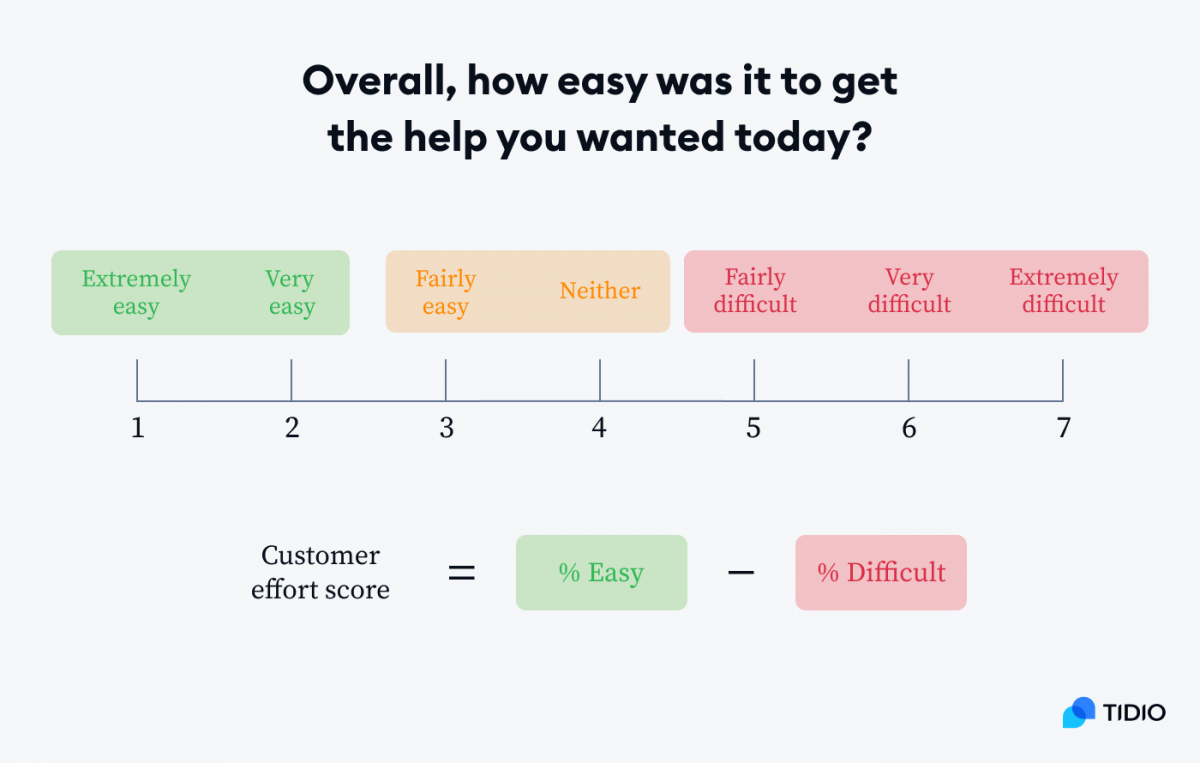
Customer effort score (CES) calculation starts from distributing a survey to your clients. This survey consists of just one question: “How easy was it to get the help you wanted today?”
- Consumers then can answer by rating it on a Likert scale from 1 (very easy) to 7 (very difficult) just like we discussed when measuring CSAT
- To get your score, you need to subtract the number of clients who answered “very easy” and “easy” from the ones who chose “difficult” and “very difficult” in the survey
Why does it matter?
It is important to know the customer effort score to be able to improve the customer service your company provides to the clients. All the more so as the lack of efficiency and accuracy are the top causes of customer service frustration.
A study found that improving the effort score from 1 to 5 increases client loyalty by 22%. This means that once you measure, keep track of, and work on improving your customer effort score, your shoppers’ loyalty increases.
So, if your clients struggle to get the help they need from your support team, your score will be very low. But you’ll know the problem is in the amount of effort it takes to contact your brand, purchase your products or resolve their issue. You can then work on making the purchase process smooth and easy for the clients.
Benchmark for customer effort score
An average CES ranks at about 29.2%. Generally, any increase or decrease of 10% should set off alarm bells in your organization.
Let’s move on to discover how to choose the right customer success metrics for your business.
Choose the right metrics
When deciding on what to track, make sure to choose the consumer metrics that work for your company. Focus on what areas you want to measure and why they are important to your brand’s success.
You shouldn’t blindly copy your competitors or try to match them. You can look at the benchmarks and see what they’re doing right. Remember that each company is different and needs to measure different aspects, staying on top of what matters most to them.
Things to consider when deciding on your KPIs include:
- Long and short term goals
- Size and location (online/ offline) of your business
- The stage of development your business is at
Ensure your customer success metric is effective for your business by checking if it:
- Measures short and long term performance
- Has a direct impact on your business
- Is quantifiable and easy to track
- Is easy to understand for everyone at the company
And one more thing—
Make sure your company is data-informed, not data-driven.
What’s the difference?
Focus on achieving your business goals, not metrics. KPIs are there to enable you to measure the results of your strategies, not to become your strategy.
So, ensure that you have a healthy relationship with customer success metrics and use them to implement your strategies. Strategy is an abstract idea, and SaaS KPIs give strategies a form and allow us to grasp them better. But if you try to replace strategies with metrics, it can destroy your company values.
Create a customer success KPI dashboard for your business
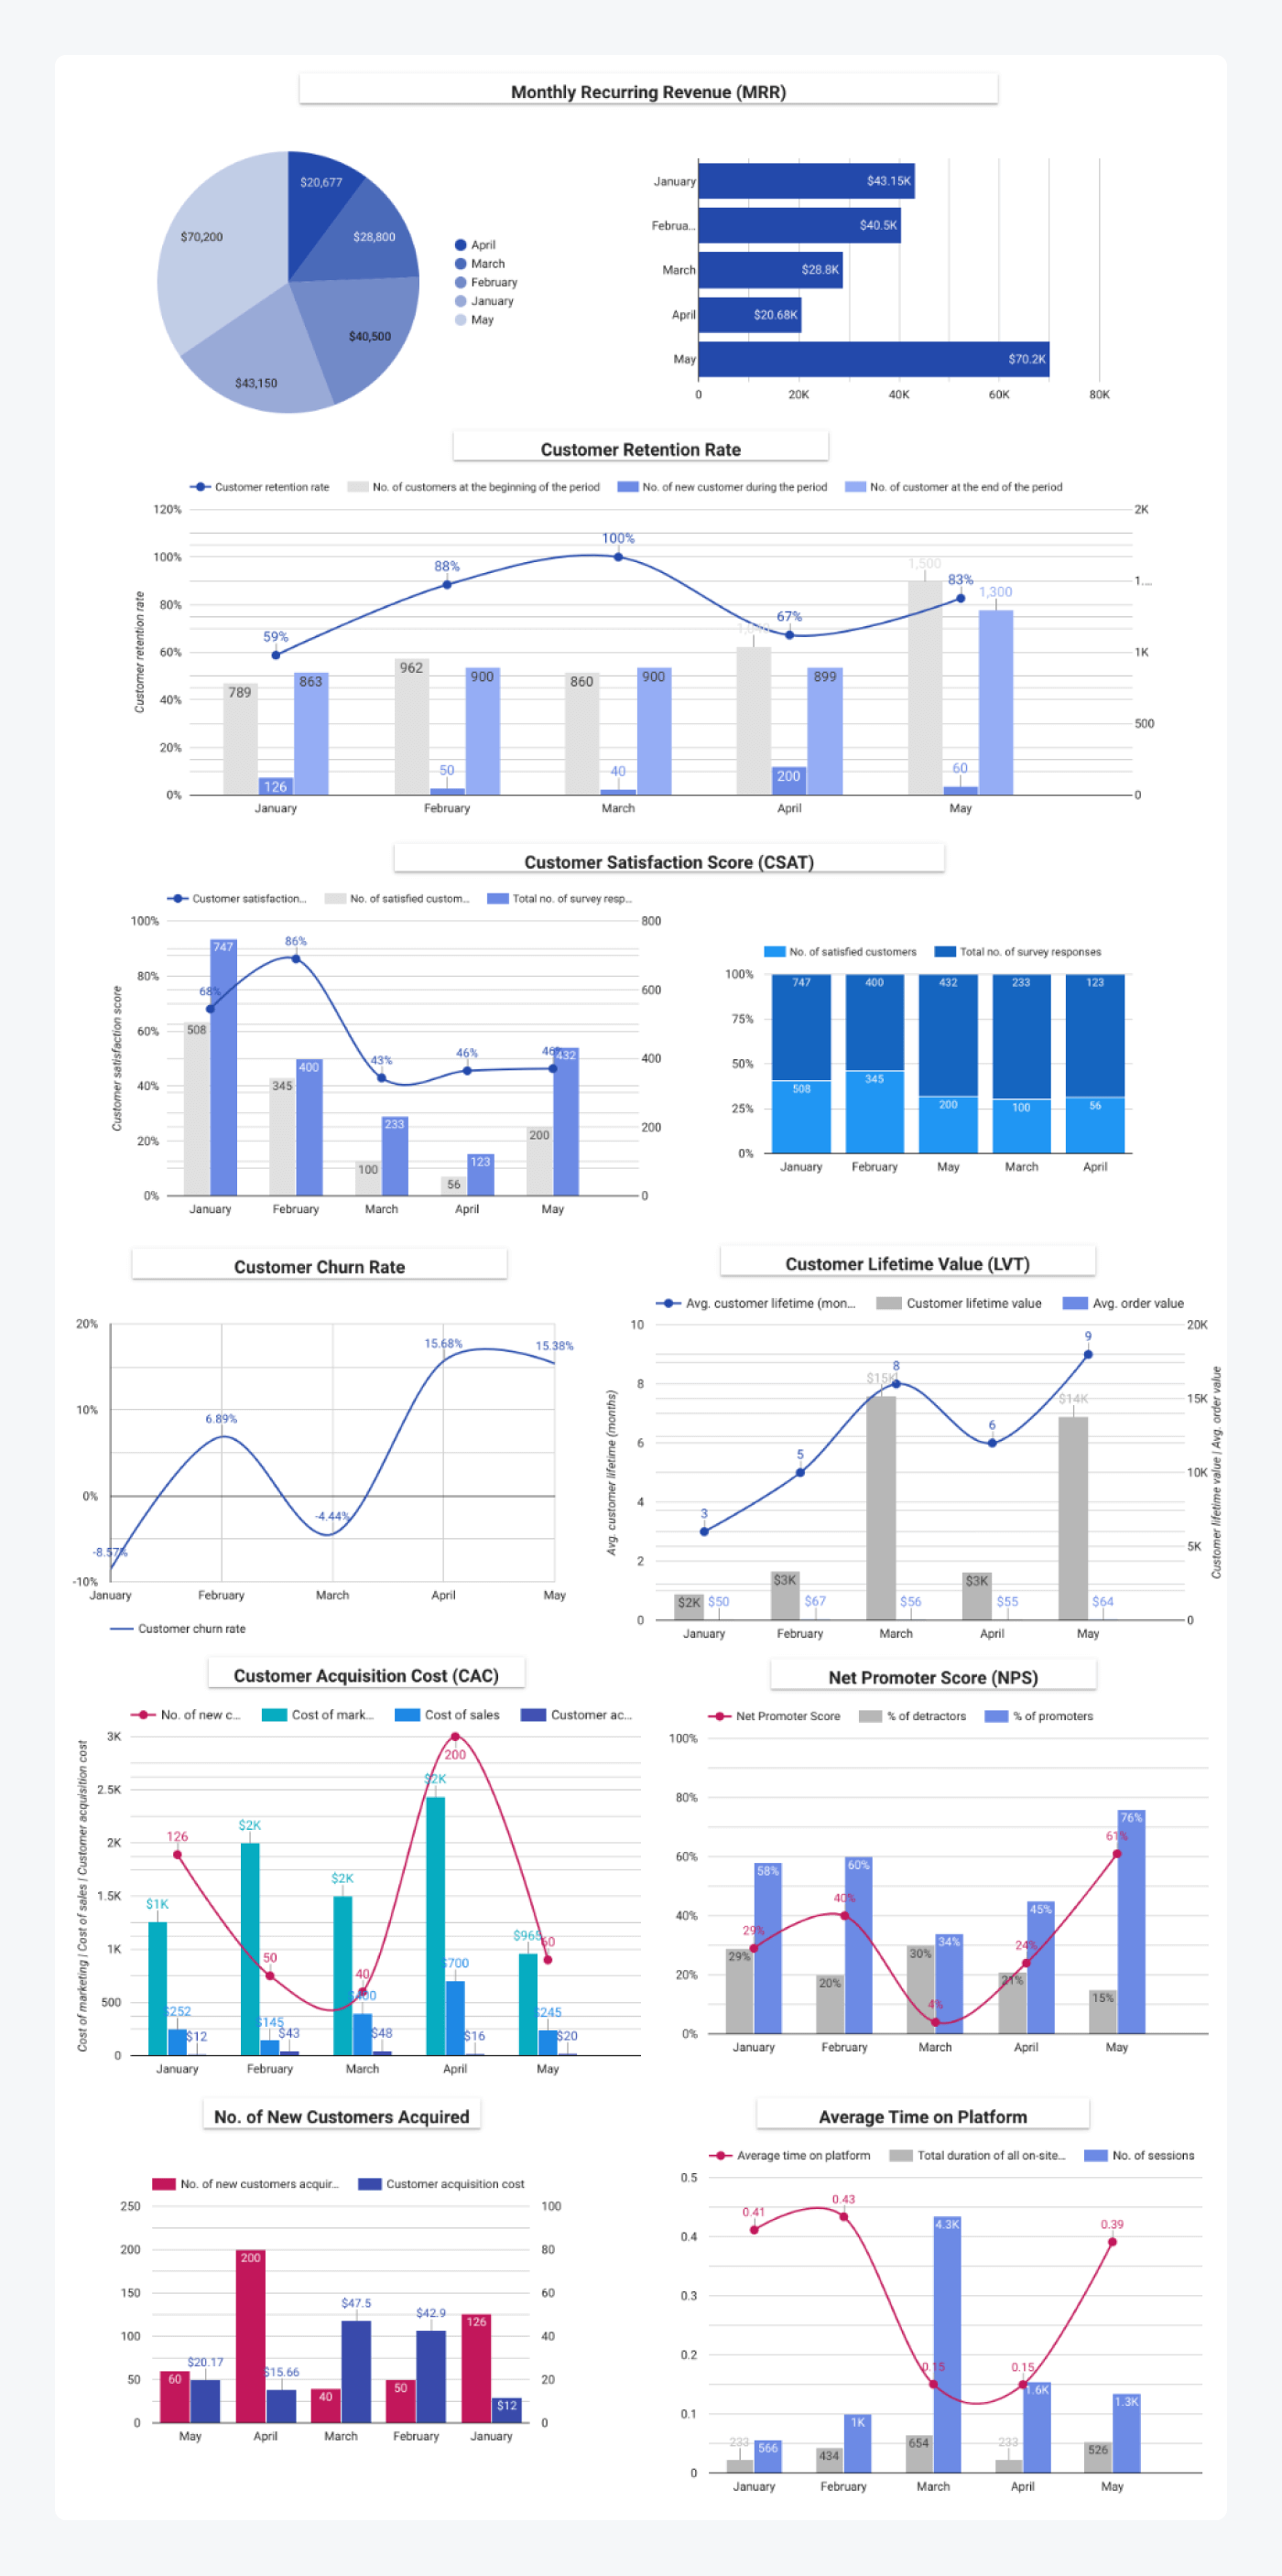
Once you choose your set of numbers, it’s time to create your customer success KPI dashboard so you have a visual representation of your results.
The KPI dashboard is a visual display of your key SaaS customer success metrics so you can see clearly what they are and keep track of them.
Some say that machine learning and AI algorithms will transform dashboards to become smarter, more anticipatory, and more personalized in the future.
But for now, let’s see how to start visualizing your data.
To begin with, decide how to best show your most important customer success KPIs. This can be a line graph, bar graph, geographic map, etc.
You can go through different visualizations in this article.
Then, choose which platform to use for creating your dashboard. I recommend Google data studio which you can connect with your Google Analytics, Google Ads, or Google Spreadsheet. Whichever one of them you decide to store your data and do your measurements.
This is an example of a customer success KPIs dashboard using metrics from this article:
You can also use this template from Databox for an easy display of your numbers. This dashboard is free, but you will need an account to get it.
And once you finish creating your customer success metrics dashboard—don’t hide it. Display it on your wall. Somewhere where you and your team can always see it and keep track of it.
This way, your business will be more inclined to implement changes and improvements. Who doesn’t like to see the results of their hard work displayed in plain view? Nobody.
But everyone hates seeing the failures, so your teams will work extra hard to improve these numbers regularly.
You can always alter what to calculate when you see more value in implementing different measurements into your dashboard. You can scrap the ones that aren’t giving you the results you were hoping for and add those that show potential for improving your brand.
But remember to give it time. You won’t be able to see how your customer success metrics change and affect your organization within a month. They need time to show you accurate results.
Key takeaway
Here are the most important customer success metrics:
- Net promoter score
- Customer lifetime value
- Customer acquisition cost
- Churn rate
- Customer satisfaction score
- Customer retention rate
- Monthly recurring revenue
- Average time on a platform
- First contact resolution rate
- Free trial conversion rate
- Repeat purchase rate
- Customer effort score
Remember that KPIs are essential for your business growth and keeping track of your performance. But you need to make sure to choose the right ones to gain the most out of your customer success dashboard.
To get the fullest picture, use multiple customer success metrics. One number isn’t enough to give you a good image of where your company’s at.
And remember not to obsess over numbers. Your company should strive towards implementing a strategy and becoming customer-centric. Not metrics-centric.

