First things first—
What are help desk metrics?
Help desk metrics are measurements that track and analyze the performance of a company’s help desk efforts. These KPIs include customer satisfaction, net promoter score, ticket volume, average response time, and many more.
They help businesses find areas for improvement, increase productivity, as well as set realistic but challenging performance goals.
But how to analyze these help desk KPIs properly and optimize for better performance?
That’s what we’re gonna show you.
Get the best help desk system and start measuring your KPIs today
Let’s get straight to the point, shall we?
15 essential help desk KPIs
Tracking your helpdesk performance metrics helps you understand how well you’re meeting customer expectations, which areas need improvement, and where problems occur more often. This will help you improve your customer service and support so you can grow your business more efficiently.
So, let’s jump into it. Here are the essential help desk metrics you should be tracking in your business:
1. First response time
First response time measures how long it takes for your support team to initially respond to a new customer support ticket. It starts when a ticket is created and ends when the first response is logged.
This help desk metric is one of the most critical customer service KPIs. Quick first responses let clients know their issue is being worked on and improve customer satisfaction. Slow responses can cause shoppers to get frustrated and look for alternatives.
To measure first response time, you should look at the difference between when a support ticket is opened versus when the first response is logged.
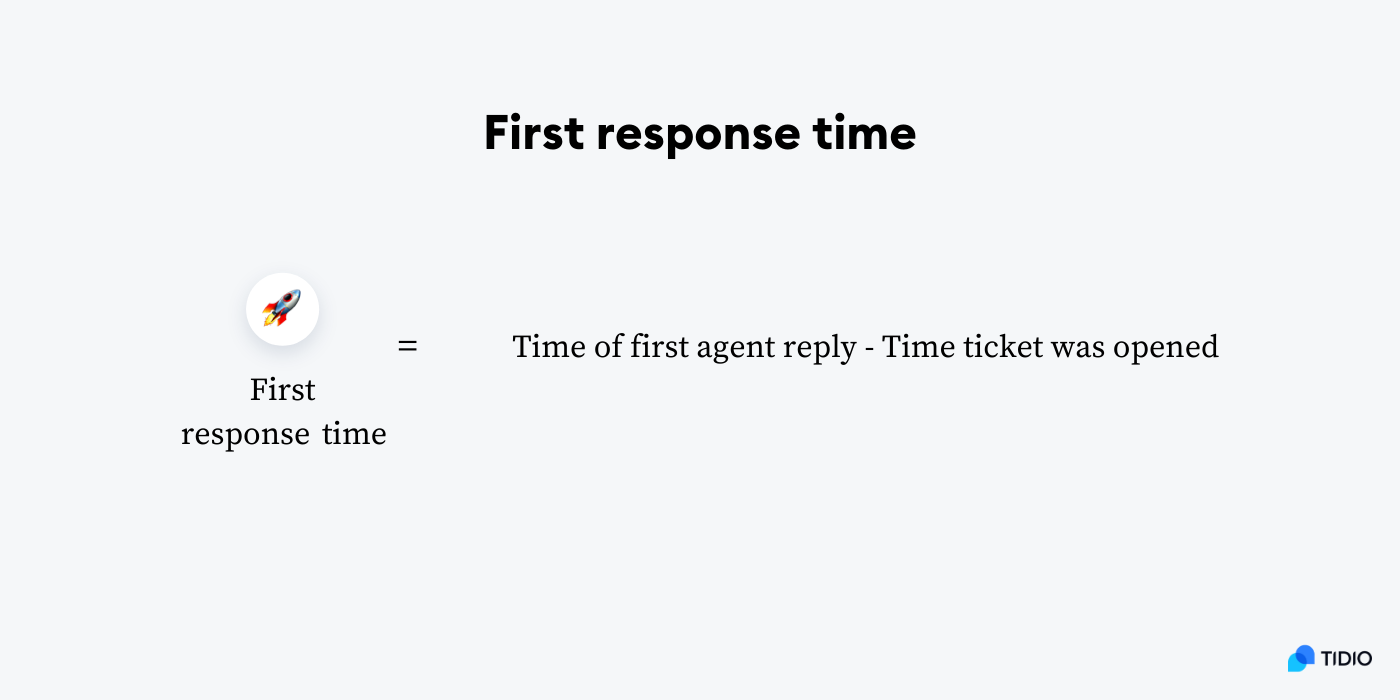
To track it effectively, your helpdesk software needs to record when the ticket gets opened and the initial response for each ticket. This will allow you to easily view average first response times across all inquiries for any given period.
Improve your results by:
- Setting up automatic ticket assignments to agents
- Using priority level routing to fast-track urgent issues
- Monitoring real-time queues to spot rising volumes
- Using canned responses for common support requests
- Utilizing AI chatbots to handle common questions instantly
Industry standard: the benchmark for the first-response time in 2023 was 4h 42min.
2. Resolution time
Resolution time measures how long it takes for a support ticket to be completely resolved after being opened by a customer. It starts when the ticket is created and ends when it’s closed or marked as resolved.
This metric is important because fast resolution results in a better customer experience. Clients want their issues fixed quickly, slow resolutions lead to frustration and negative brand perceptions. Tracking this metric helps identify process bottlenecks.
You can measure this help desk KPI by subtracting the time a ticket was opened from when it was closed or marked as resolved.

In order to effectively track this metric, you should record the ticket open time and the resolution for each ticket in your helpdesk ticketing system. Then, calculate the resolution hours or days for all tickets in a given period. On top of that, try to find the average resolution time across inquiries to identify improvement areas.
To improve your results in this area, you can:
- Set up internal SLAs based on ticket priority
- Use root cause analysis to prevent recurring issues
- Create a knowledge base for self-service resolutions
- Automate responses for common requests
- Review skills gaps and provide additional training
Industry standard: typical average resolution time varies between 4.45 minutes and 8.7 minutes.
3. Ticket volume
Ticket volume measures the total number of support tickets opened during a given time frame (hour, day, week, month, etc.).
Tracking this help desk KPI is important because it allows you to forecast staffing needs, identify recurring issues, and monitor growth. For example, sudden spikes could indicate problems, while low ticket volume may signal poor customer adoption.
To ensure your numbers are accurate and you’re on track with your results, check the dashboards frequently and look at the longer period. This will help you spot any seasonal increases and catch the right moments to potentially hire more support agents.
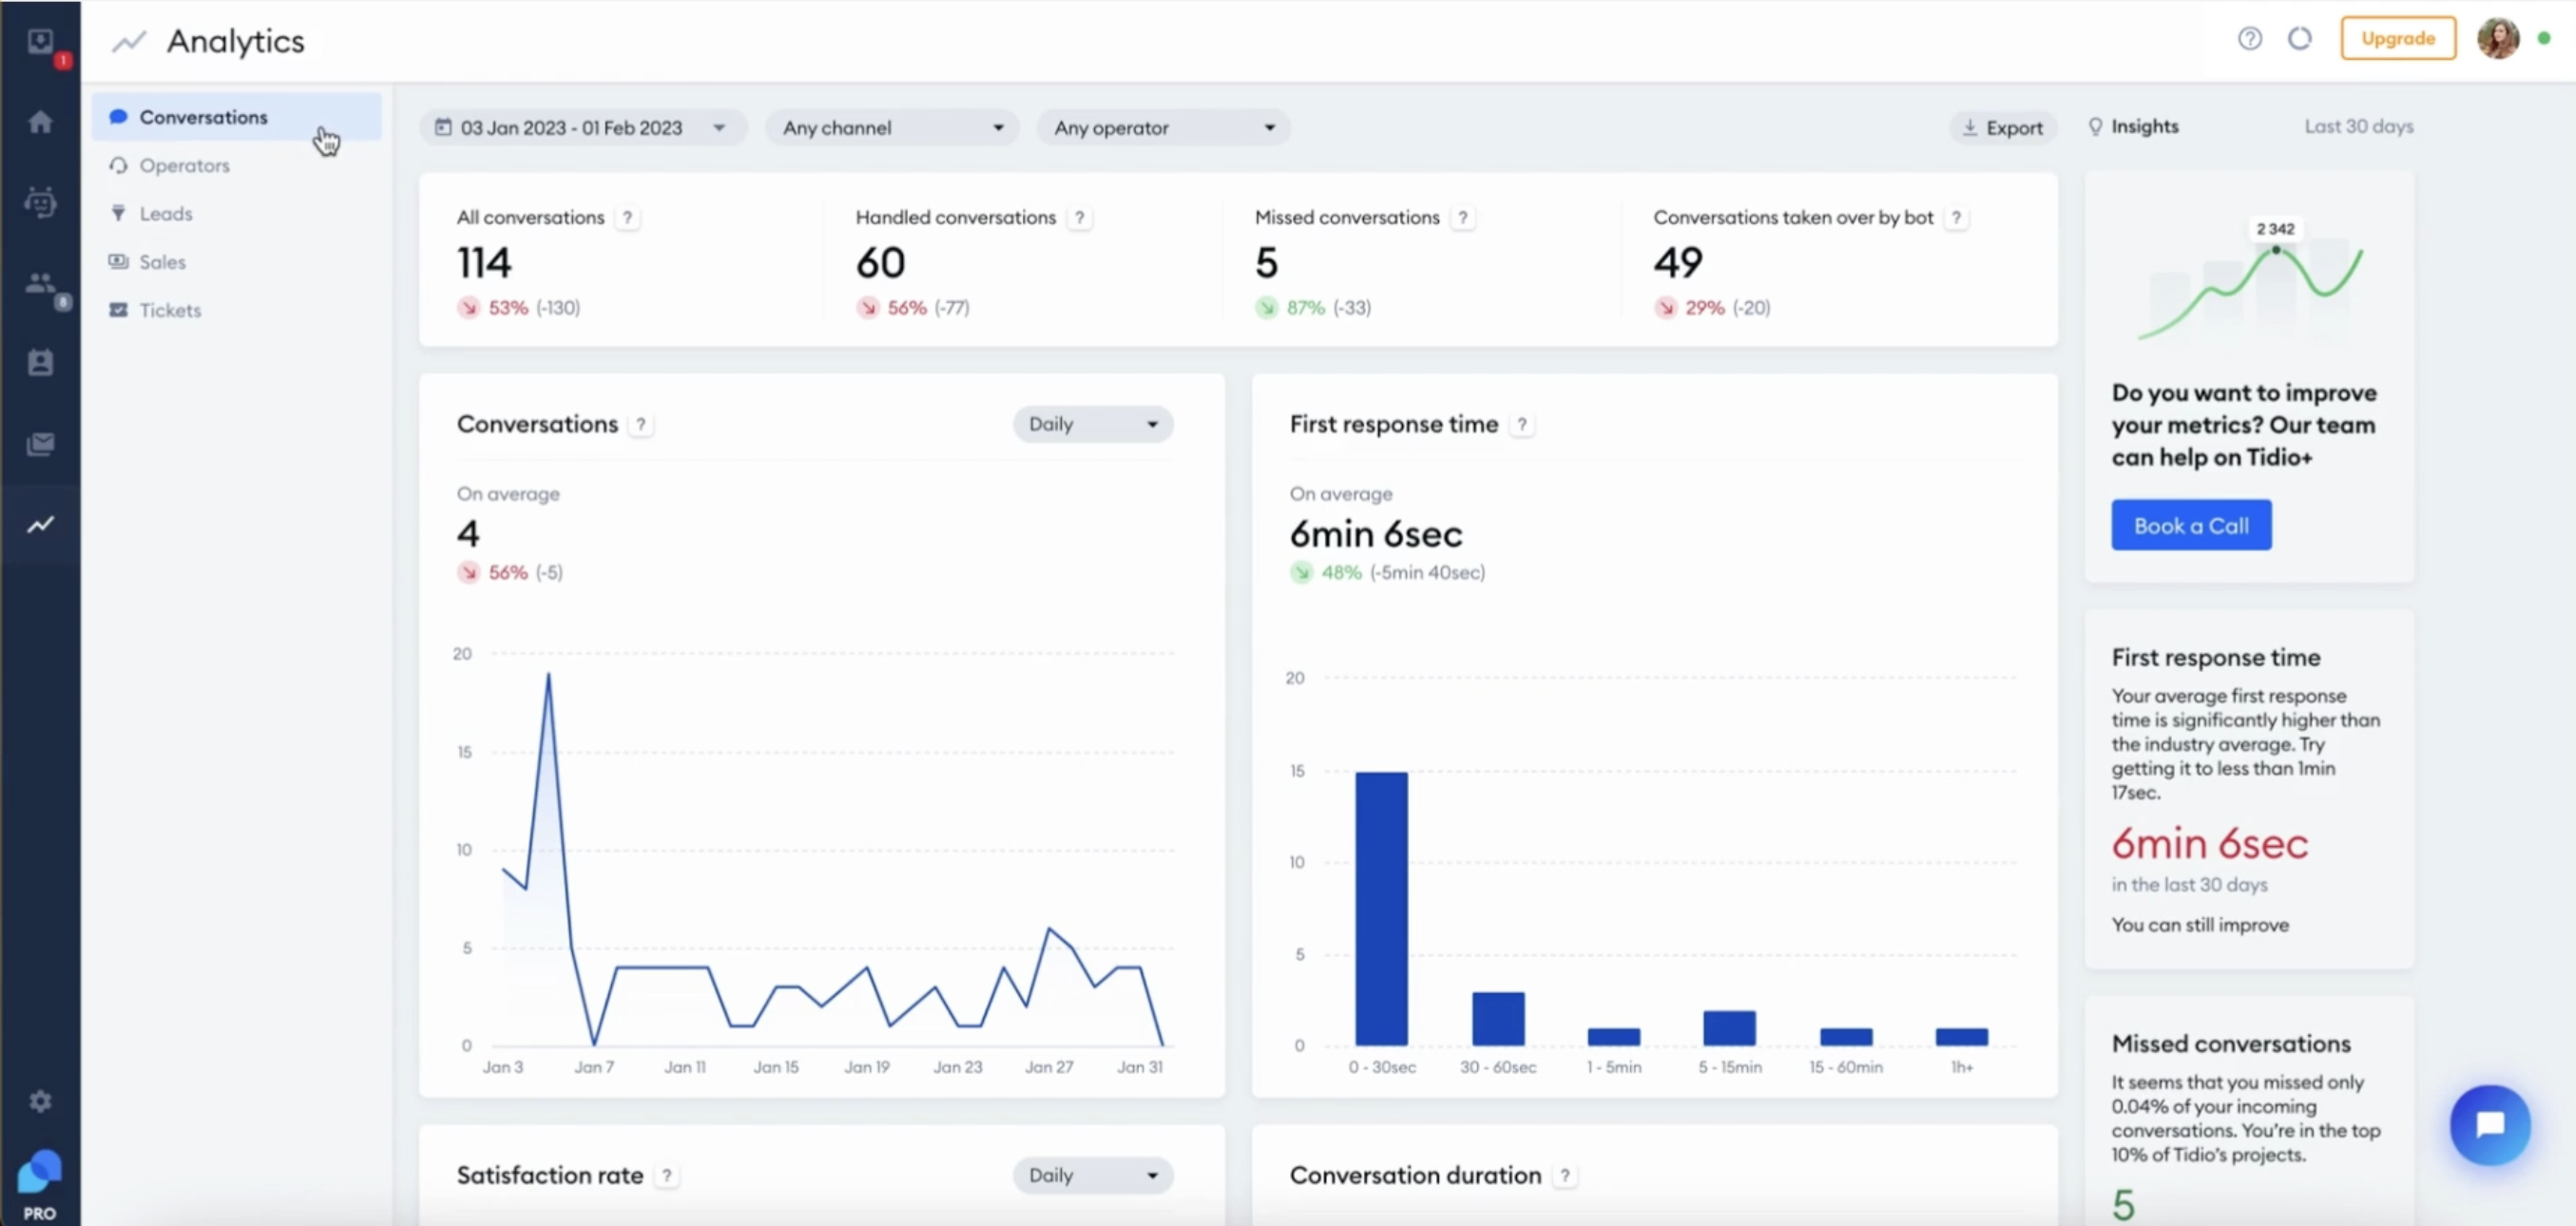
You can calculate this metric in terms of days, weeks, or months by tracking the number of new vs. resolved tickets. This is easy when using a help desk system with analytics. For example, if you use Tidio helpdesk system, you can check your Analytics tab and have a look at the Conversations started by visitors dashboard.
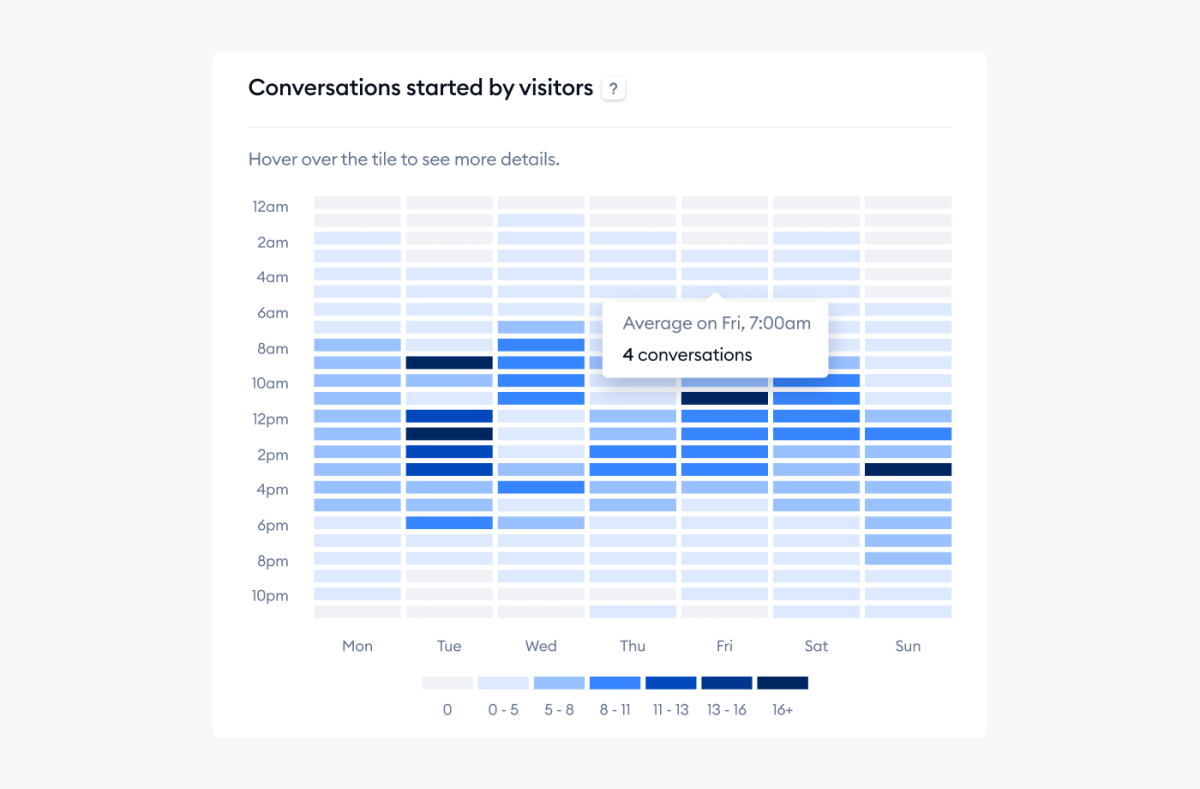
Some ways to improve this metric include:
- Leveraging help desk automation and self-service portal
- Improving knowledge base to lower simple inquiries
- Identifying recurring issues driving volume
- Analyzing trends to forecast future volumes
- Expanding service hours if needed to handle global customers
Industry standard: the average business has about 578 tickets per day, 3,991 per week, and 17,630 per month.
4. Customer satisfaction score
Customer satisfaction score measures how happy customers are with the service and support they receive. It’s usually captured via surveys and ratings after ticket resolution.
This is one of the key performance indicators of help desk success because high satisfaction scores mean you are effectively resolving issues and meeting expectations. Low scores point to areas for improvement.
So, how to calculate this metric? You’ll need to make a customer satisfaction survey first to get responses from your clients. Then, simply take the number of customers who scored your service with a rating of “satisfied” or “very satisfied” and divide it by the total number of responses. Or, you can also take the sum of all ratings and divide it by the number of responders.
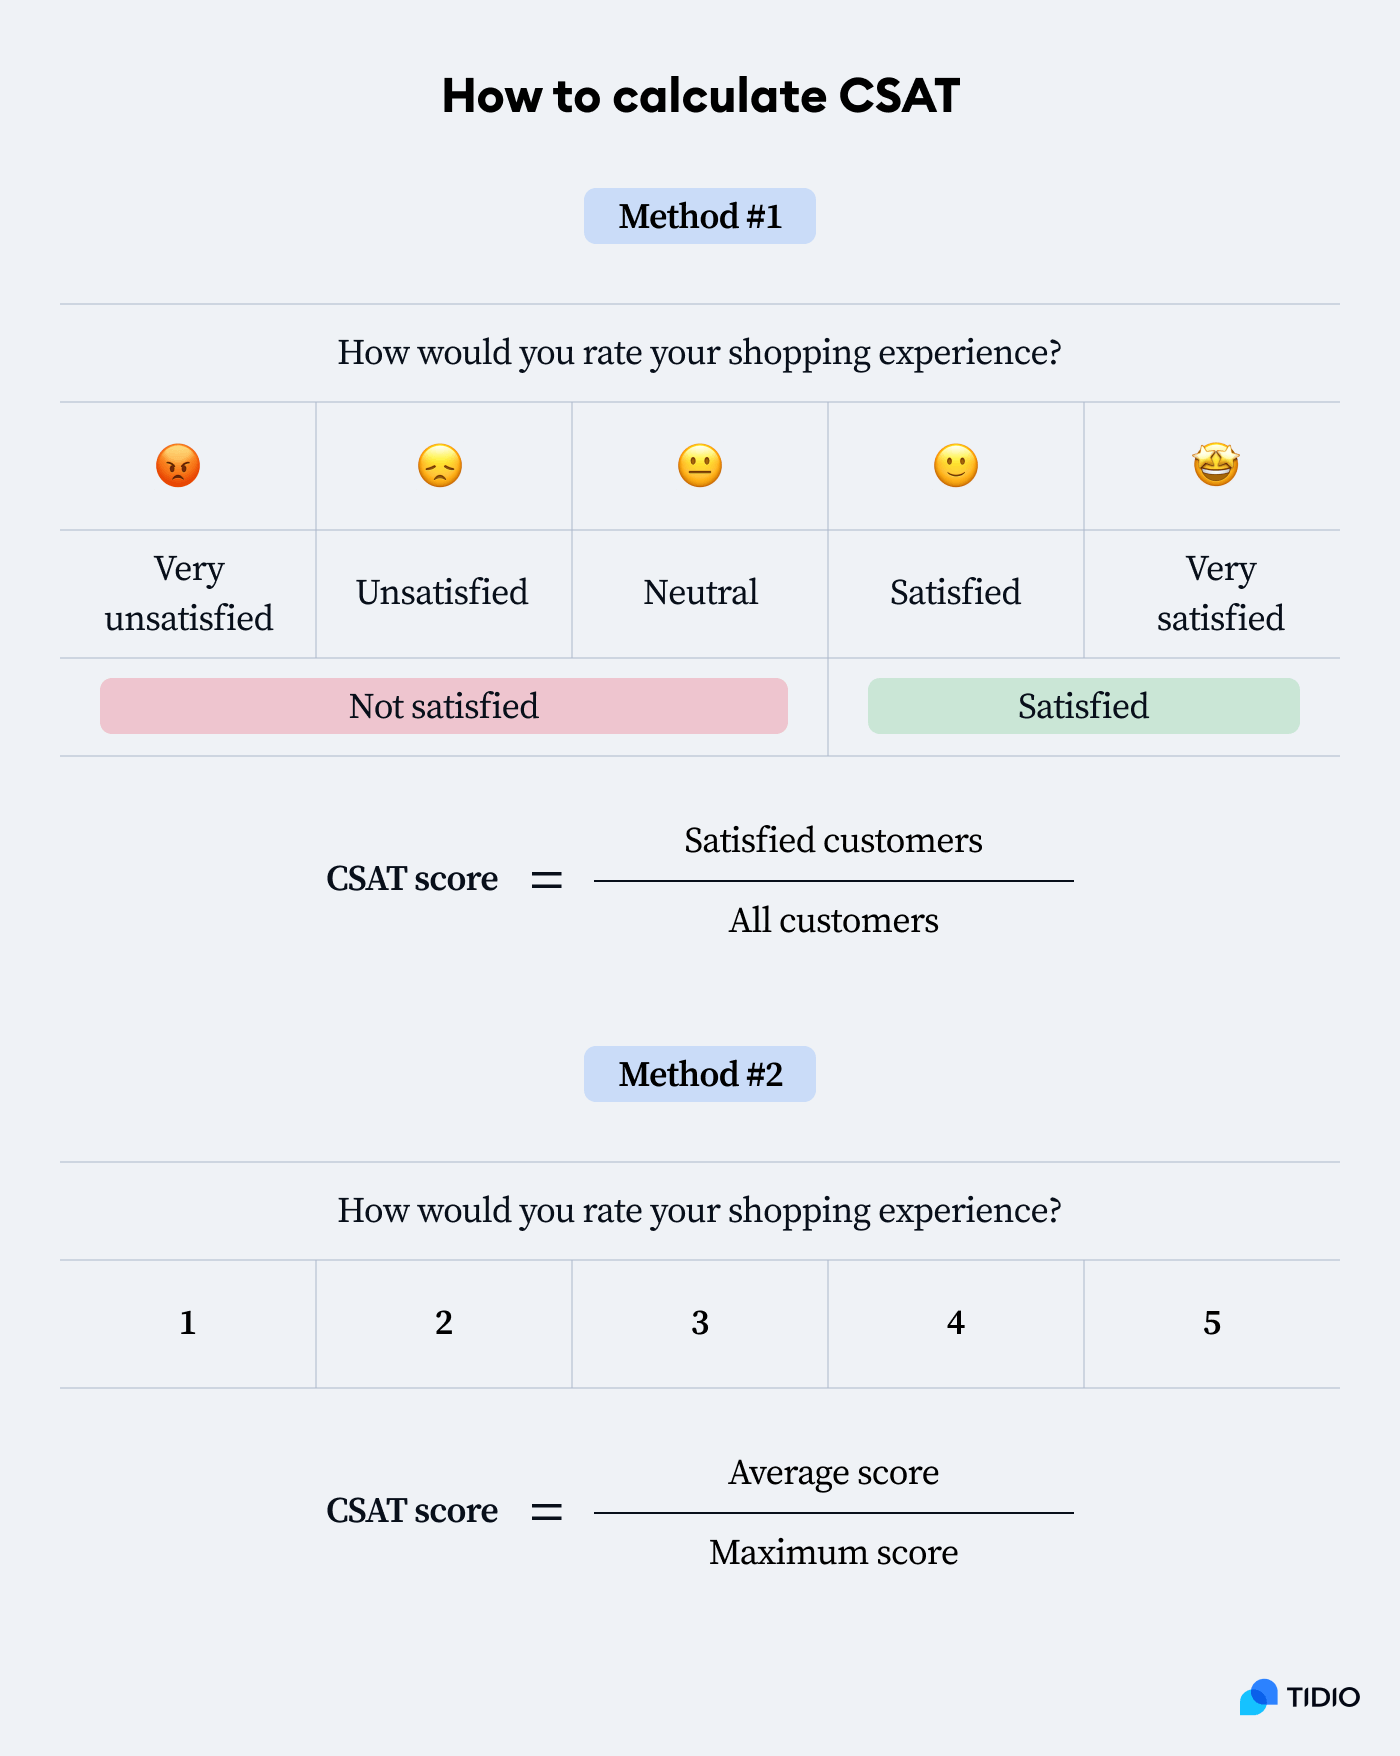
Collect a high number of responses from your customers for the most accurate results. Don’t try to evaluate the satisfaction rates of your shoppers based on less than 100 responses, as it will not give you the full picture of your customer support performance.
Some tips you can use to improve your CSAT results include:
- Sending survey links after ticket closure
- Reviewing feedback and comments regularly
- Identifying common customer complaints and frustrations
- Improving weak points through training and coaching
- Analyzing scores by representative, product, and issue type
Industry standard: the benchmark for CSAT ranges from 64% to 80%. The CSAT scores between 75% to 85% are considered good.
Read more: Discover how Beltton Wulff hit 4.5/5 ⭐️ on their customer rating using Tidio.
5. Net promoter score (NPS)
Net promoter score measures customer loyalty and satisfaction levels. It’s based on asking customers how likely they are to recommend your company’s product or service on a 0-10 scale.
NPS provides an indication of customer sentiment beyond just satisfaction. High NPS shows you have loyal enthusiasts who will refer others. Low NPS indicates dissatisfaction and lost revenue. Consequently, tracking NPS helps identify improvement areas.
To calculate this help desk performance metric, first create a chat survey for people where they’re asked to rate the likelihood of recommending your business to friends and family from 0-10.
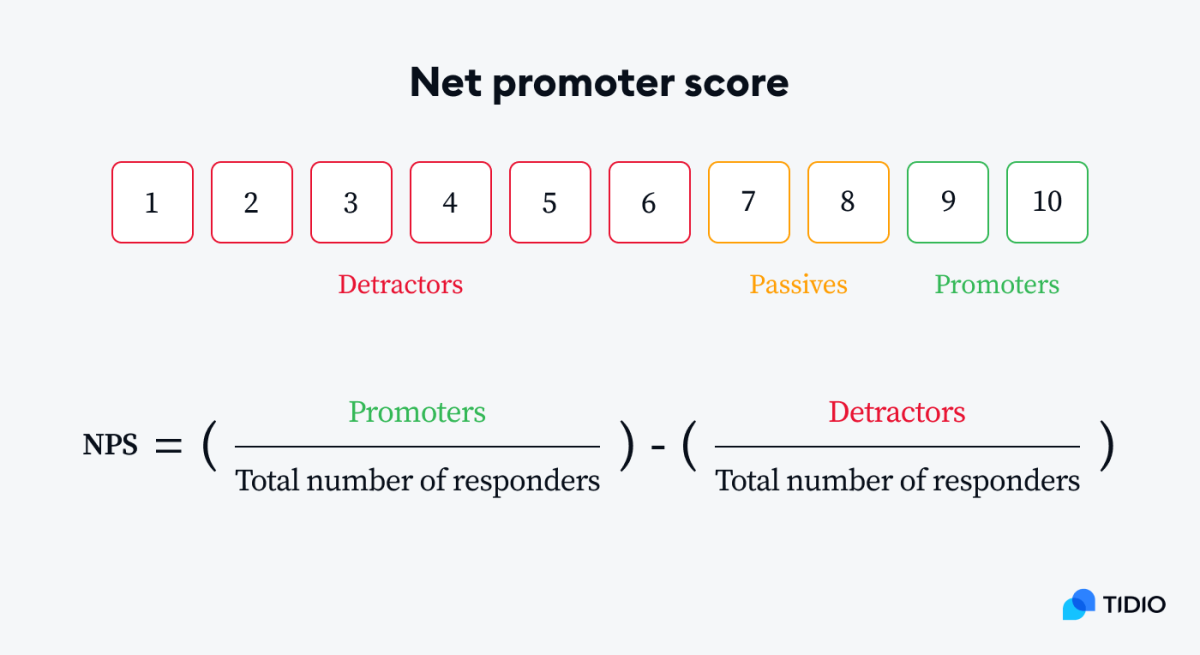
Make sure to incorporate the surveys across all of your communication channels so you can get a full picture of how your support service is performing.
To improve this score, you should:
- Review feedback from the detractors to identify issues
- Train customer service agents on courtesy, empathy, and communication
- Set an NPS target score to work towards
- Segment NPS by product, market, and customer type
- Develop retention offers for Passives and Detractors
Industry standard: for ecommerce helpdesk, the benchmark is 50 and for retail, the standard NPS score is 61.
Did you know that…
Promoters are 4.2 times more likely to buy from you again, as well as 7.2 times more likely to try a new offer in comparison to detractors.
Improve your Net Promoter Score using automations
6. First contact resolution rate
The first contact resolution rate measures the percentage of support requests that are resolved during the customer’s first interaction with the help desk, when no follow-up is required.
A high FCR rate indicates that the issues are solved efficiently and quickly. It also boosts agent productivity and lowers costs. A low FCR shows room for improvement in first-tier support.
To measure first contact resolution, take the number of inquiries resolved on first contact and divide it by the total number of inquiries. Then, take the quotient and multiply it by 100% to get a percentage result.
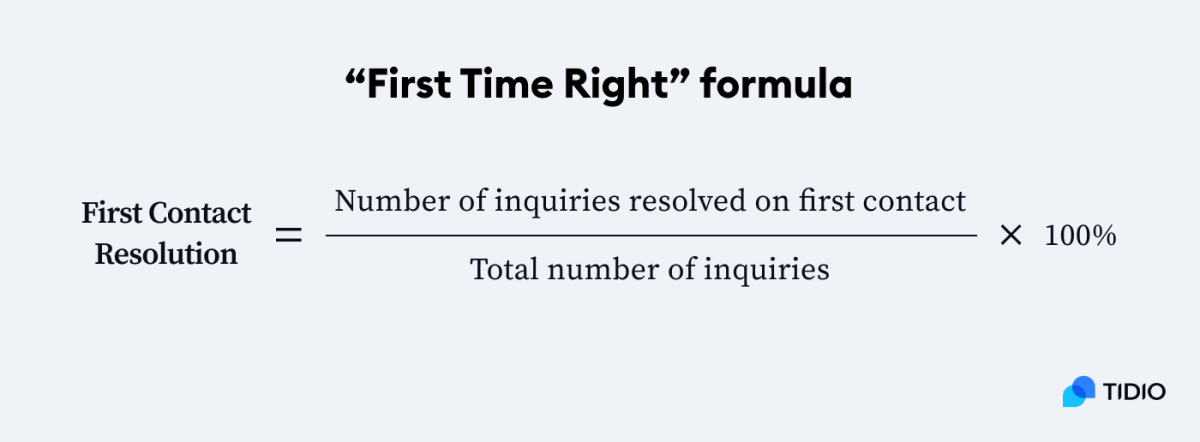
Remember to record the inquiries accurately in order to get as exact results as possible.
Here are a few tips for improvement of this help desk KPI:
- Empower agents to own issues end-to-end
- Equip agents with knowledge, resources, and tools
- Identify common reasons for poor FCR
- Improve processes that require callbacks
- Provide ongoing training on products and soft skills
Industry standard: a first contact resolution rate between 70% to 79% is a good number to aim for.
7. Agent utilization rate
Agent utilization rate measures the percentage of logged-in time that agents spend actively handling service requests and calls compared to idle time.
Monitoring utilization helps efficiency and budgeting, especially in the context of global payroll. That’s because high utilization shows agents are productive, whereas low utilization indicates idle agents and wasted payroll costs.
Utilization rate is calculated by dividing how long agents spend actively handling inquiries and calls by their total logged-in time.
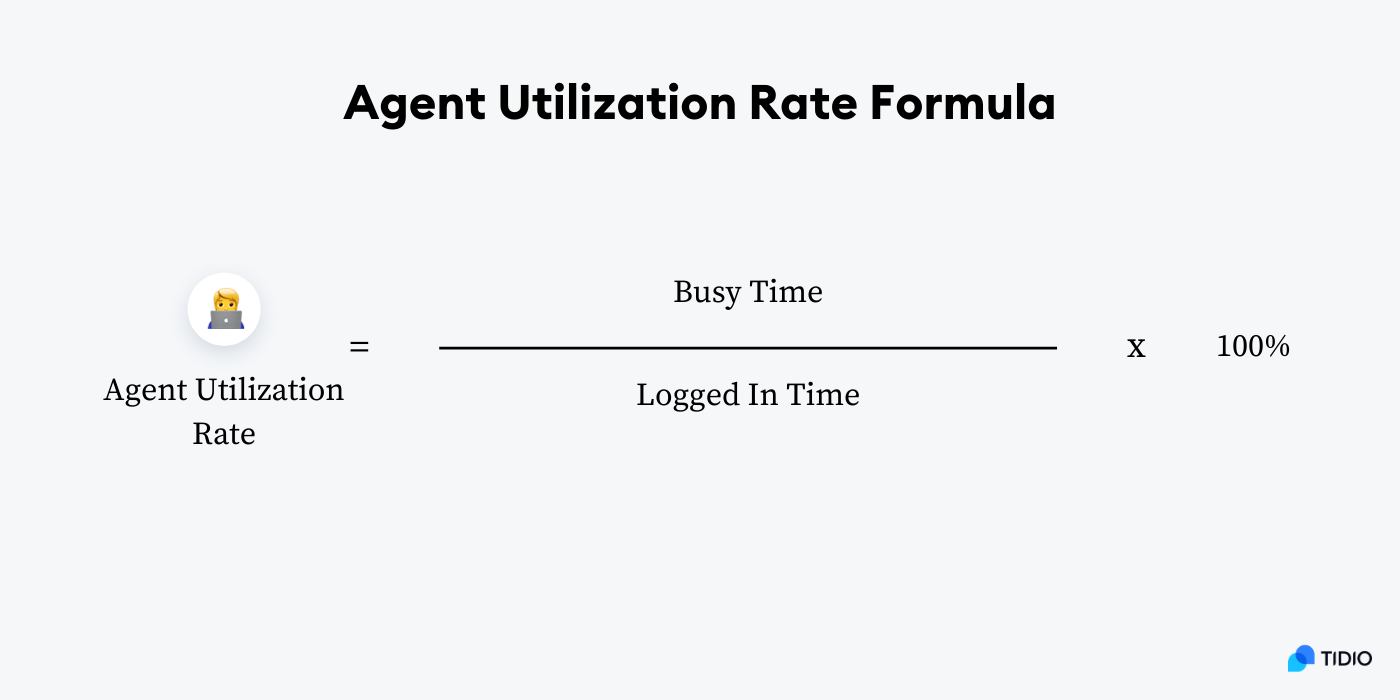
To track utilization effectively, your help desk software should log individual agents’ busy vs. idle time. You should also set a daily/weekly utilization target and identify trends in low utilization hours/days to adjust staffing. This will help you coach underperforming agents and maximize their productivity.
Some tricks to boost your agent utilization rate include:
- Setting a target utilization rate
- Tracking utilization by reps to identify low performers
- Reducing idle time through better forecasting and scheduling
- Monitoring real-time dashboard for backlogs or idle agents
- Automating common requests to allocate staff better
Industry standard: the range of agent utilization rate varies between 22% to 76% with an average of 48%.
8. Average handle time (AHT)
Average handle time measures the average period agents take to handle a customer inquiry, including talking, clients being on hold, and wrap-up/documentation.
This service desk metric impacts staffing requirements, service levels, and costs. High AHT can indicate inefficiencies. Low AHT may signal poor quality support. On the other hand, targeting an optimal AHT helps a representative’s productivity and customer experience.
To measure this service desk KPI, you should divide the total time spent handling customer inquiries by the total number of inquiries during a given period.
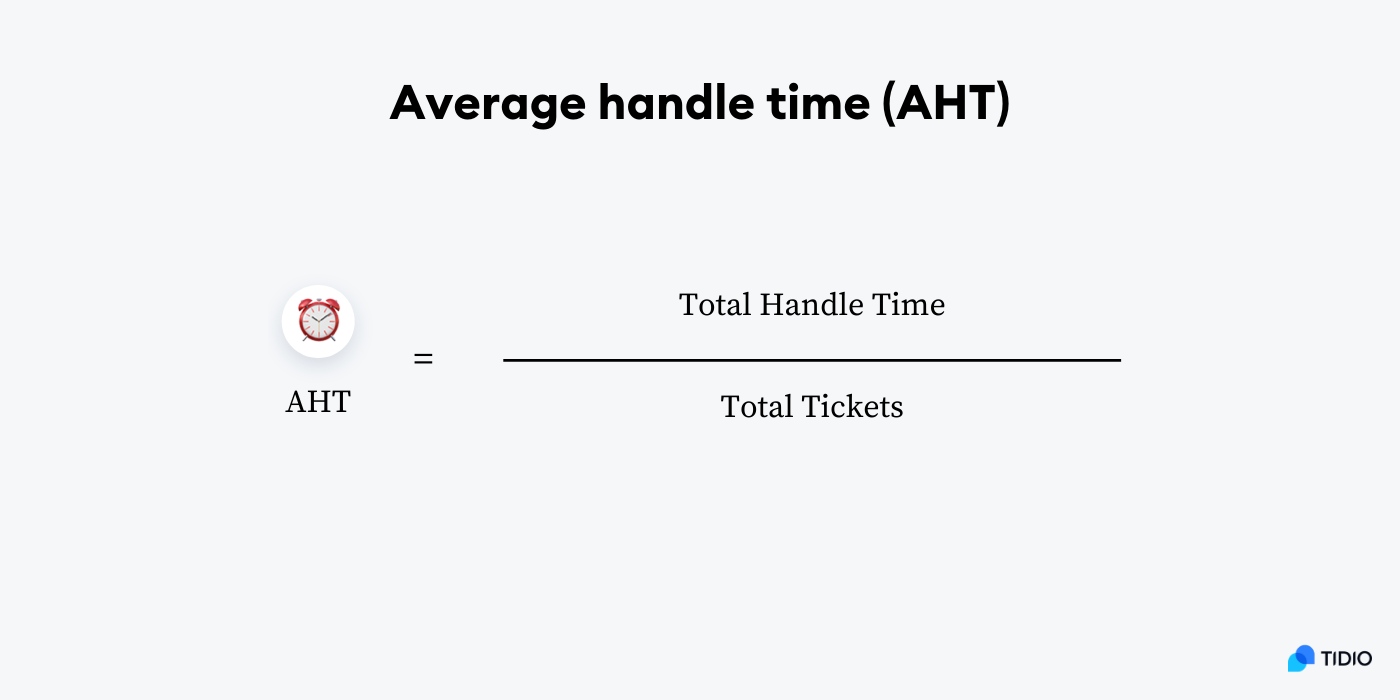
To track AHT efficiently, your help desk tool should log handle time for each interaction and filter them by agent, queue, as well as issue type to identify outliers.
Some tips for improvement include:
- Setting a target AHT based on inquiry types
- Training agents on call control, active listening, etc.
- Standardizing processes to avoid duplicate steps
- Listening to calls with high AHT to identify inefficiencies
- Developing quick reference guides and video tutorials
Industry standard: the AHT benchmark depends on the industry you’re in. It ranges from 2 minutes 36 seconds in telecommunications, through 3 minutes 29 seconds in retail, to 4 min 13 seconds in manufacturing.
Read more: Learn the difference between help desk and service desk with benefits and main features.
9. Customer effort score (CES)
This KPI for the service desk measures the ease or difficulty customers perceive in getting an issue resolved during a service interaction. It’s captured via post-interaction surveys.
The customer effort score indicates how much effort customers have to expend to get their issues fixed. Low CES (high effort) hurts satisfaction. High CES (low effort) improves loyalty and retention.
To calculate this metric, you need to first collect customer feedback about your support services and help desk team through surveys. Ask shoppers how easy it was to get the help and give them a scale of 1 (very easy) to 7 (very difficult). Then, subtract all the people who answered 1 and 2 from the people who answered 5-7.
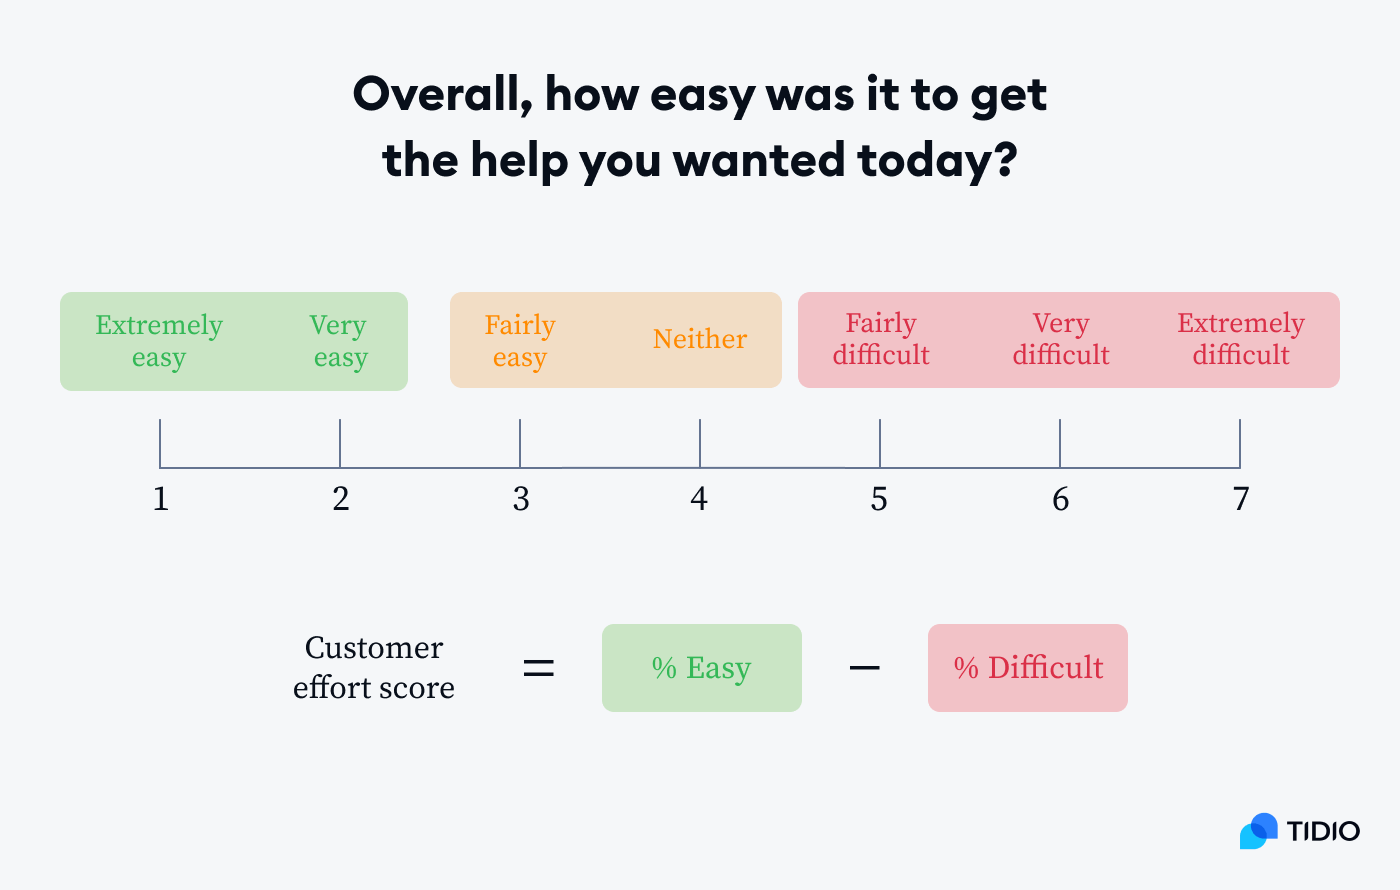
Make sure the surveys are quick and easy to answer. Send them after the customer support interaction and make sure to include them on a variety of channels for the most accurate results.
You can improve this KPI by:
- Identifying drivers of high-effort experiences
- Reviewing negative feedback for improvement ideas
- Streamlining processes and handoffs
- Setting custom notifications
- Automating repetitive inquiries
Industry standard: CES benchmark scores above 90% indicate that your business is in a strong position.
10. Predicted backlogs
Predicted backlogs estimate how many open help desk tickets you can expect at a given time based on historical trends.
Forecasting backlogs helps to avoid excessive delays by ensuring you have an appropriate number of agents working at any given time. Unexpected backlogs lead to missed SLAs and poor customer experience.
Now—the bad news is that there is no one way or an easy formula to calculate and predict your help desk backlog. But here are some methods you can use:
- Look at historical ticket volume trends by day of week and hour of day to identify patterns
- Build a forecast model based on recurring spikes and dips
- Calculate the rolling average of daily/weekly ticket volumes over the past month or quarter to estimate baseline volumes
- Factor in seasonality by comparing volumes across previous years. Identify monthly or quarterly spikes
- Consider external drivers of volume like new product releases, promotions, and upcoming events
- Measure current staff capacity based on the number of agents, their productivity, and schedules
- Estimate expected backlog by subtracting forecasted volume from current capacity
- Track real-time emerging backlogs by calculating open minus closed tickets hourly or daily
- Set up helpdesk software to calculate and display real-time backlog metrics on dashboards
To allocate adequate resources, combine historical data, external factors, and real-time monitoring to provide visibility into emerging backlogs. The goal is to balance staffing costs with customer service levels.
Some best practices for improving this metric include:
- Automating alerts when backlogs exceed thresholds
- Maintaining a bench of trained overflow agents
- Establishing trends and seasonal patterns
- Balancing backlog targets with customer satisfaction
- Developing a forecasting model based on history
Industry standard: backlog as a percentage of monthly volumes should be between 0.1% and 7.6% depending on the priority of the tickets.
11. Transfer rate
Transfer rate measures the percentage of customer inquiries transferred from the initial agent to another agent or team before resolution.
High transfer rates indicate inefficiencies like underskilled agents or unclear routing policies. This drives up handle time and customer effort. When you optimize transfer rates, you have the chance to improve first contact resolution.
To calculate this IT help desk metric, divide the transferred tickets by the total number of queries. Then multiply that by 100%.
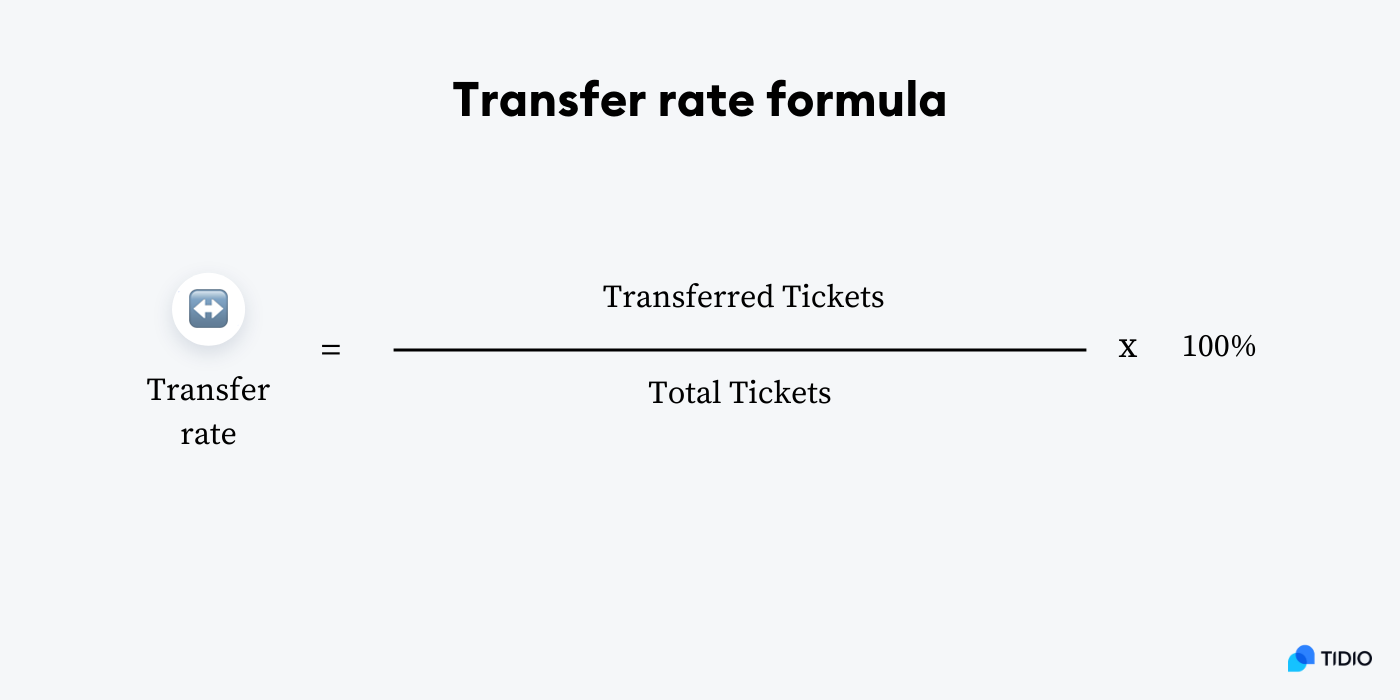
Your helpdesk software needs to track transfer instances and run regular reports on the number of transfers vs. total tickets. Also, you should survey customers on their transfer experience and satisfaction to understand their experience in more detail.
To improve this KPI for service desk, you can:
- Identify common transfer reasons and gaps
- Expand the team’s omnichannel knowledge and skills
- Create expert groups for complex customer issues
- Refine routing rules to limit unnecessary transfers
- Educate customers on best channels for different issues
Industry standard: the call center benchmark for the transfer rate is 19%.
12. Service-level agreement compliance
Service-level agreement (SLA) compliance rates measure the percentage of support tickets that meet their designated service-level agreements for response time, resolution, or other metrics.
SLAs set customer expectations for service quality and speed. While high SLA compliance indicates reliability, low compliance hurts customer satisfaction and loyalty. Tracking this metric motivates support team members to improve.
This helpdesk KPI provides visibility into the service team’s quality and whether it can meet customers’ needs efficiently. You can calculate it by taking the tickets meeting your SLA and dividing them by the total number of inquiries. Then, multiply it by 100%.
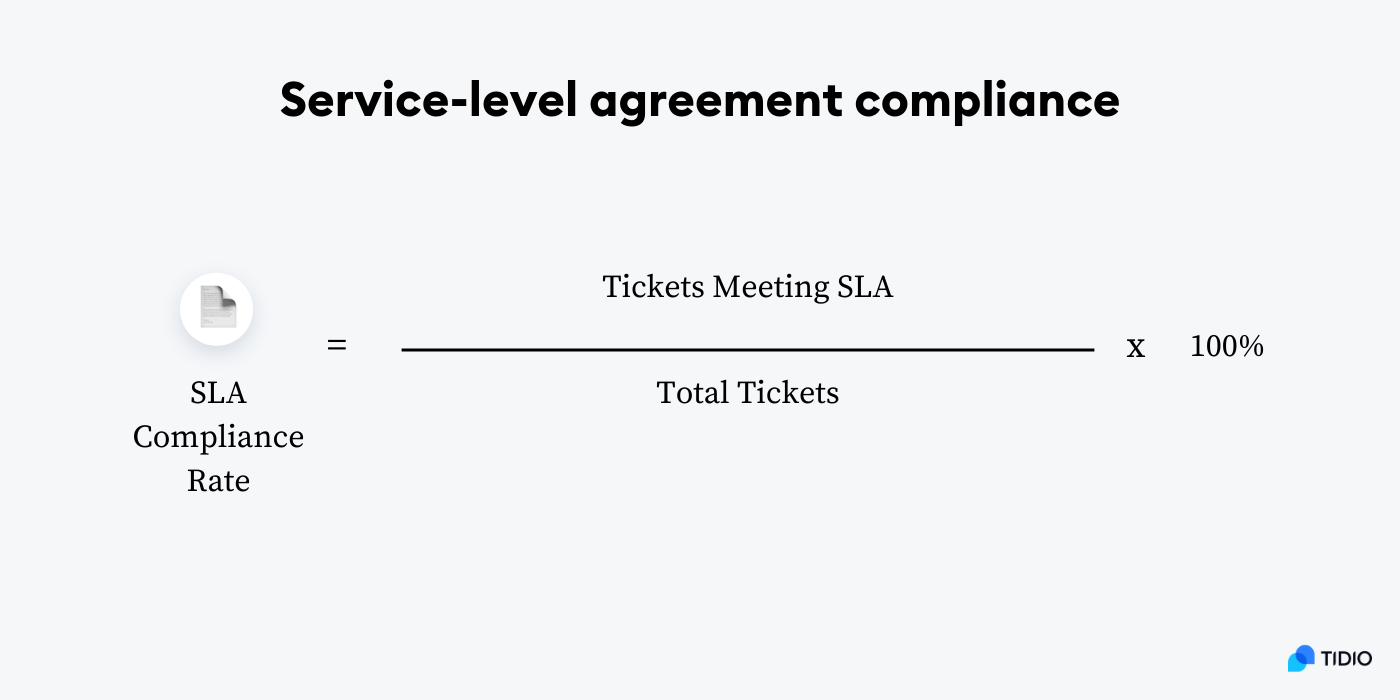
To track SLA compliance, first define SLAs for each priority level, department, or service type. Then, configure help desk software to automatically calculate compliance.
Some tips you can use for improvement are:
- Setting realistic SLAs based on resourcing
- Monitoring real-time dashboards for SLA breaches
- Refining priority level definitions and routing
- Updating customers on expected resolution wait
- Balancing SLAs with customer satisfaction targets
Industry standard: dependent on your business. For example, if your support team usually responds to emails in an average of 5 hours, a good SLA for email would be to respond within 4 hours.
13. Escalation rate
Escalation rate measures the percentage of customer inquiries that require escalation to a higher tier of support, supervisor, or manager to get resolved.
It’s important to know your escalation rate because high rates signal gaps in first-tier support which increases resolution time and customer effort. By analyzing ticket escalations, you can spot the areas to improve and where to provide more training. Also, minimizing escalations empowers first-tier agents to handle more issues independently. This creates shorter resolution paths and happier customers.
To calculate your escalation rate, you should divide the number of escalated support inquiries by the total number of tickets.
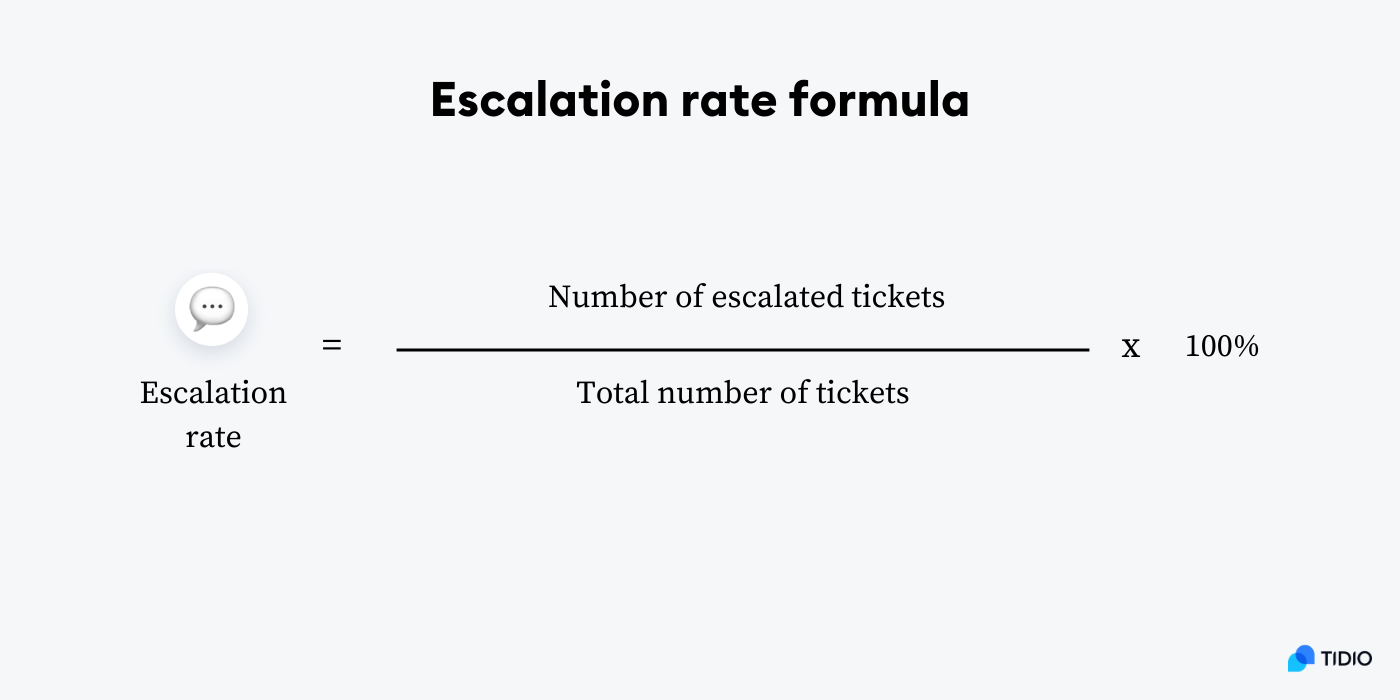
In order to track this metric, run regular reports and share these reports with agents responsible for high escalation rates. Also, survey customers on escalation experience and satisfaction to get more in-depth information.
Here’s what you can do to improve this metric:
- Identify common reasons for escalations
- Coach agents on troubleshooting skills
- Update internal documentation with lessons learned
- Clarify escalation protocols for faster routing
- Standardize escalation procedures and SLAs
Industry standard: keeping the escalation rate below 10% is an advisable reference point.
14. Support tickets opened vs. solved
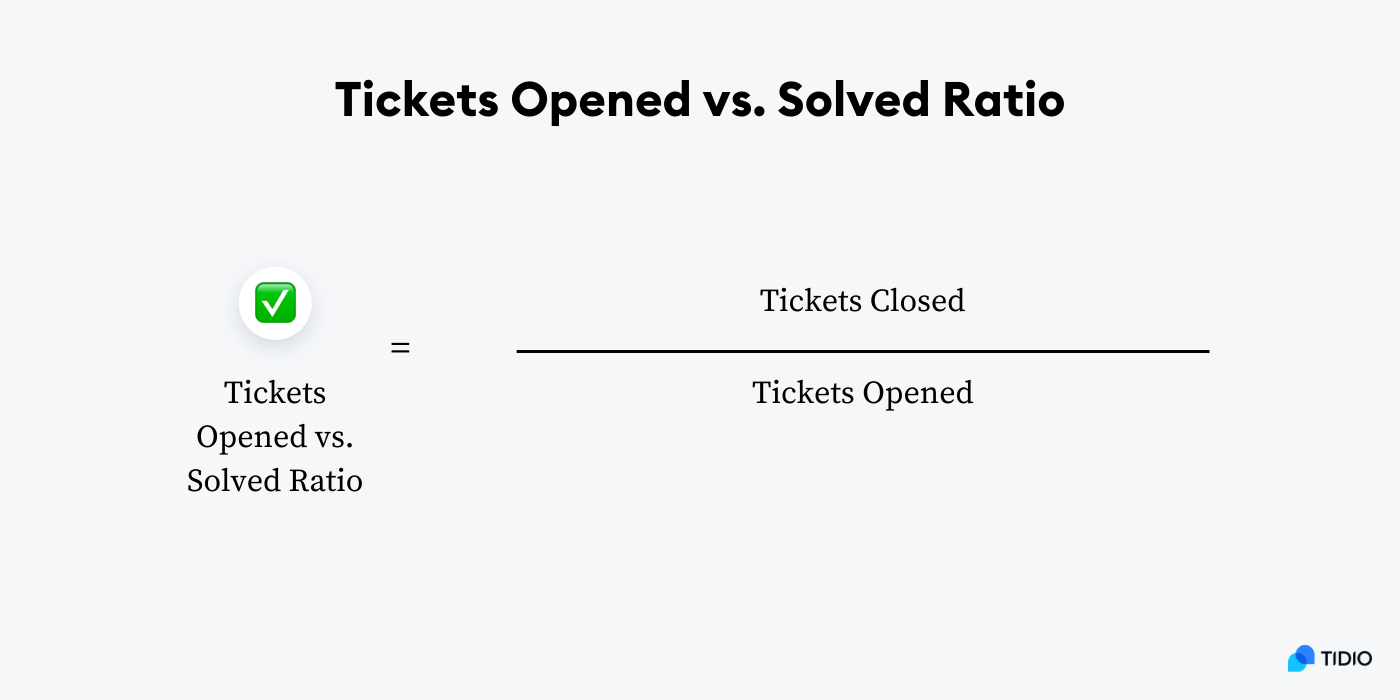
This IT help desk performance metric tracks the number of new support tickets opened compared to the number of resolved queries during a given period.
Comparing them provides insight into the support team’s workload and backlog management. This simply means that when your opens exceed closes, the backlogs grow, and when your solved tickets exceed opens, the backlogs shrink.
To calculate and track support tickets opened versus solved, you should pull ticket reports for a set period (day, week, month) from your helpdesk system. Count the number of requests that were opened in the period and the tickets that were closed/resolved. Then divide the closed tickets by the ones that were opened.
Regularly calculating, tracking, and comparing tickets opened and closed ensures your customer support team works down backlogs while keeping closure rates high. This helps maintain service levels and customer satisfaction.
Tips for improvement:
- Stick to the period of time you set for a couple of months
- Optimize help desk workflow efficiency to increase closure rates
- Prioritize clearing older tickets when backlogs grow
- Analyze trends in ticket closure rates by agent
- Consider automation to streamline common request resolution
Industry standard: you should aim for a ratio of 2:1 for tickets opened vs. solved.
Read more: Discover tips and best practices for helpdesk management.
15. Ticket distribution
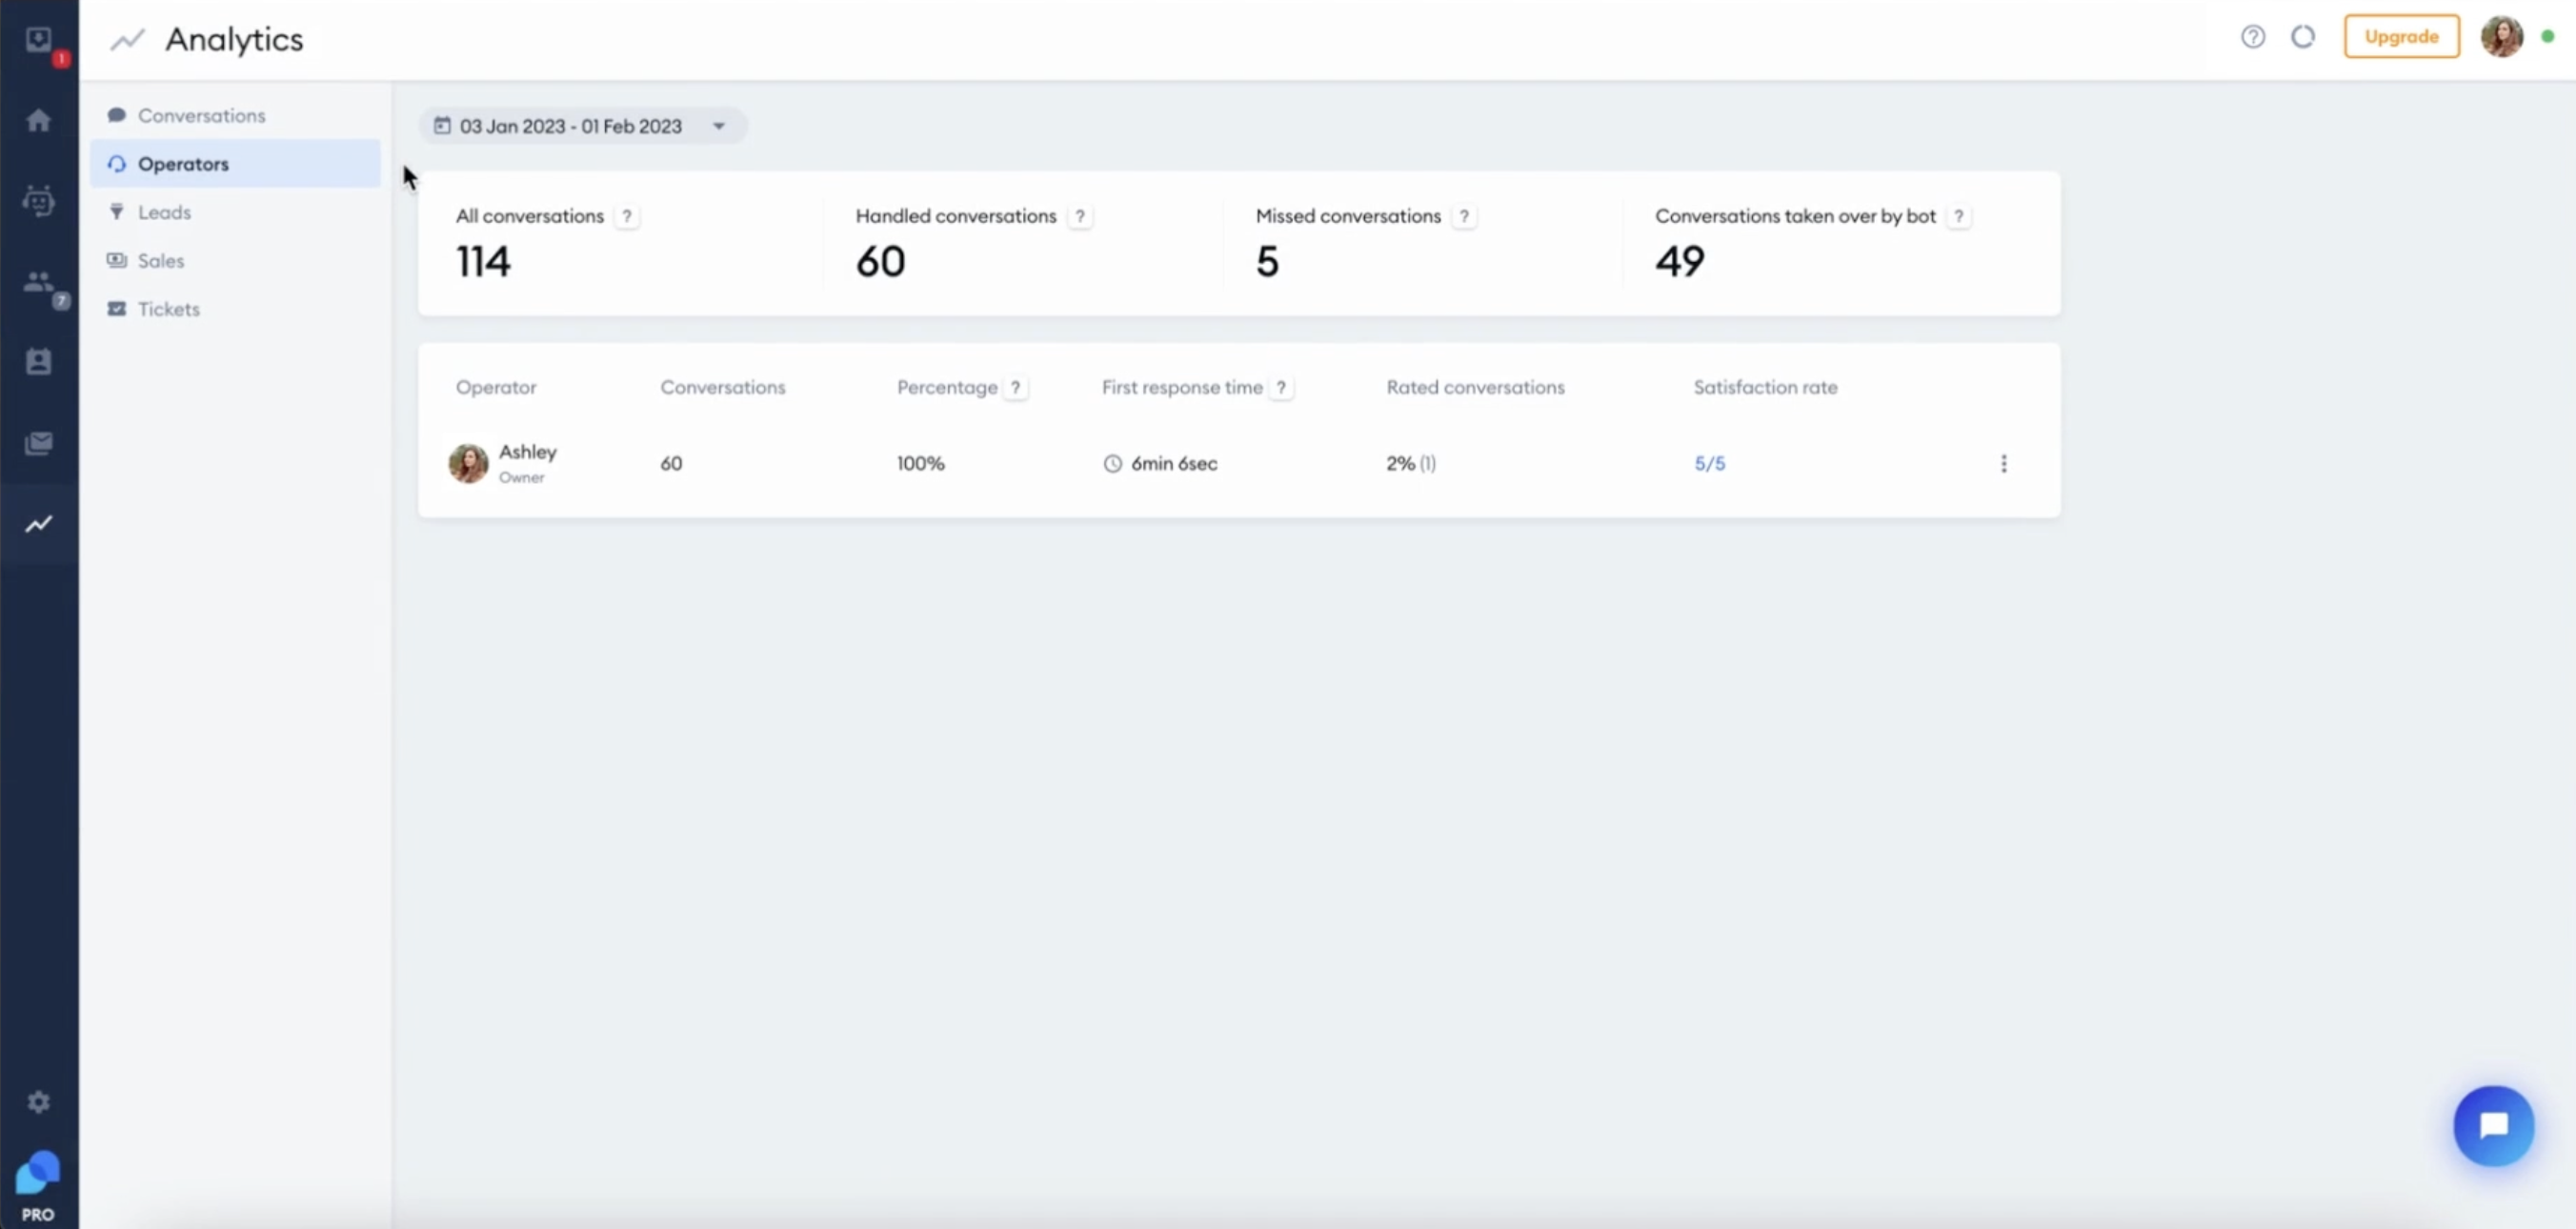
Ticket distribution refers to analyzing the spread of support tickets by characteristics like issue type, product, department, channel, reps skill set, priority level, etc.
Analyzing ticket distribution is important because it identifies trends in workload and customer needs. It helps with skills-based routing, product development, staffing plans, and more.
You can look up your ticket distribution between agents on your help desk metrics dashboard. If you’re using Tidio, go to the Analytics tab and click on Operators. You’ll be able to see how many tickets each rep handled.
To improve this helpdesk KPI, you can:
- Categorize tickets using tags, types, and custom fields
- Examine distribution trends over weeks, months, and quarters
- Reallocate agents to balance workloads
- Train agents on handling larger categories
- Route certain categories to specialized agent groups
Industry standard: depends on your business. For example, the distribution of tickets by hour can show you that most of the requests are coming in between 9am and 12pm, while if you look at the days of the weeks, Wednesday is usually the busiest.
Read more: Learn how to use Tidio analytics to measure results automatically.
Okay—
Now that you know the metrics you should be using, let’s look at some tips to measure your results effectively and improve your support.
Help desk metrics: best practices
To effectively track help desk metrics and KPIs, you should follow some best practices including choosing the right measurements, building dashboards, sending user-friendly surveys to customers, and more. So, here are some tips you should follow:
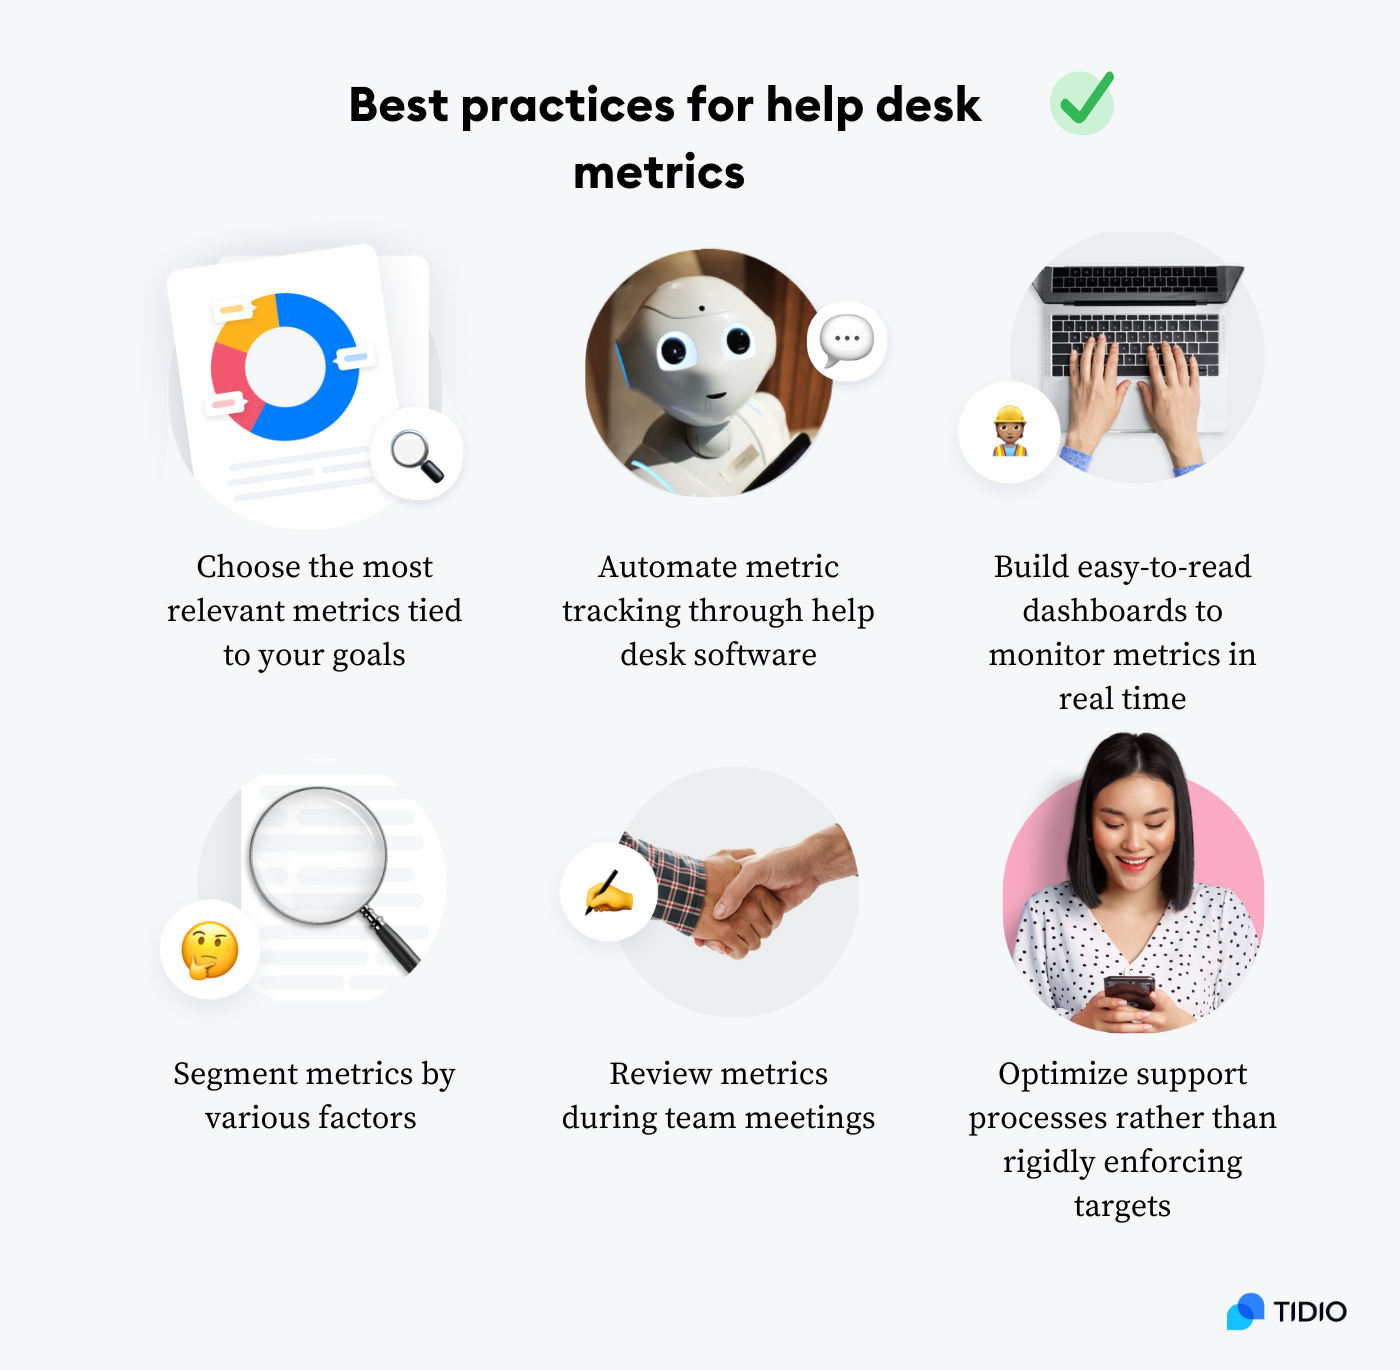
Choose the most relevant metrics tied to your goals
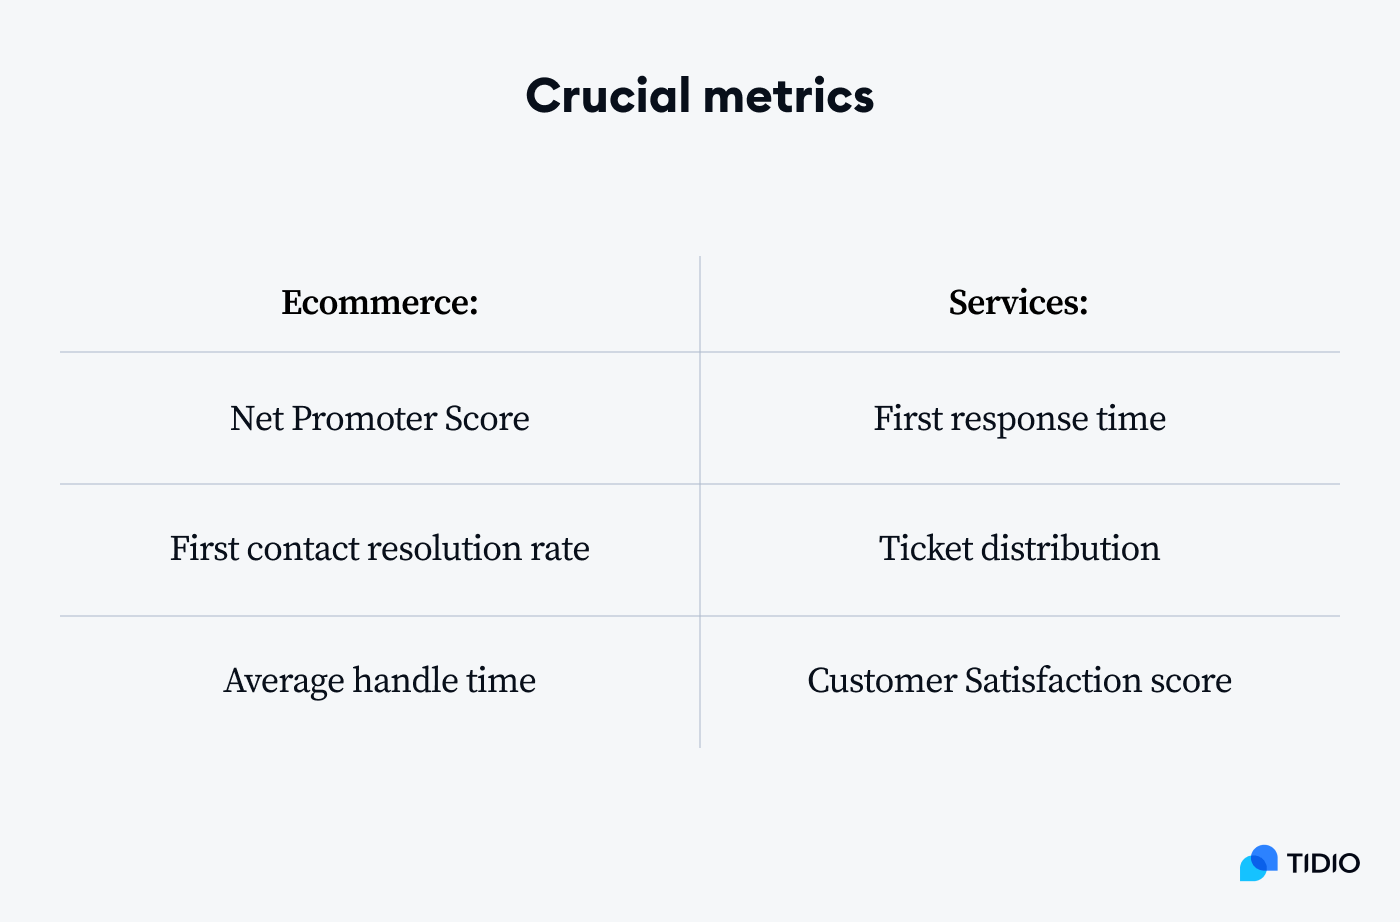
Carefully select a focused set of the most important help desk metrics that will provide visibility into your goals and objectives. For example, if fast resolution time is critical to your brand, track metrics like first responses, average handle time, and resolutions. And remember to avoid metrics that look impressive but don’t further your goals.
Also, make sure you have specific, measurable targets for each metric that is reasonable and aligns with your business objectives. Unrealistic targets demotivate teams, so make your targets achievable but also push for improvement.
Automate metric tracking through help desk software
Rather than using manual processes, leverage the capabilities of your help desk platform to automatically track key performance metrics. Automation provides real-time visibility at scale and minimizes human effort. This will prove better for your business than relying on manual reports, as it’s more efficient and gets rid of human error.
Build easy-to-read dashboards to monitor metrics in real time
Create help desk dashboards that present metrics clearly and concisely so you can share them widely with agents and managers. It’s also important for dashboards to be visible in real time to drive progress, so ensure your business metrics are easy for end users to interpret.
You can also schedule reports with help desk metrics to be automatically distributed on a regular basis, such as weekly or monthly. Look at trends over different periods to identify seasonality, outliers, and other insights.
Segment metrics by various factors
Break down help desk metrics by dimensions such as agent, department, issue type, priority, etc. This helps identify opportunities for improvement specific to these segments that may be hidden in aggregate metrics.
On top of that, carefully examine metrics for any data points that seem unusual, form a pattern or trend, significantly violate or exceed targets, etc. Then, perform root cause analysis to understand the reasons driving these data points.
Review metrics during team meetings
Make reviewing help desk metrics a consistent part of team meetings. Discuss trends, progress toward targets, and areas that need work. This will help you keep everyone informed and brainstorm ideas for improvement.
Another thing you can do during the meetings is to compare your metrics against published benchmarks for your industry. Research help desk metrics industry standards beforehand to understand how your performance compares and gauge your competitiveness.
Optimize support processes rather than rigidly enforcing targets
Don’t overly prioritize help desk metrics targets above the customer experience. Find ways to genuinely improve service quality rather than taking shortcuts to artificially boost metrics.
At the same time, continuously re-evaluate your help desk metrics to ensure they are still the right ones to drive your current goals as needs evolve. Tweak target levels, analysis methods, and reports as appropriate.
Helpdesk metrics: summary
Optimizing help desk operations is crucial for delivering excellent customer service and support. There’s no arguing about that.
And implementing key metrics provides the visibility you need to continuously improve your help desk. With KPIs, you can track first response time, resolution time, customer satisfaction, and agent utilization. You can also identify strengths, uncover problem areas, and measure progress.
One of the crucial best practices for tracking help desk metrics is comparing your results against industry benchmarks. That’s because it gives a sense of your performance standards.
But don’t get fixated on those. If you want your team to be motivated, then set achievable targets tied to the representative’s incentives.
So, choose the best help desk system for your company and start automatically collecting metrics today.
Optimize support operations with the best help desk solution on the market

