Ecommerce is changing the world of retail as we know it. People’s shopping habits change quickly too—buying things on the internet is becoming the new norm.
However—
How can you adapt your business to the ever-changing online shopping trends? How to build a strong ecommerce based on accurate data? Will people even continue shopping online?
Let’s dive into the latest online shopping statistics with a detailed overview of some of the most recent online shopping data.
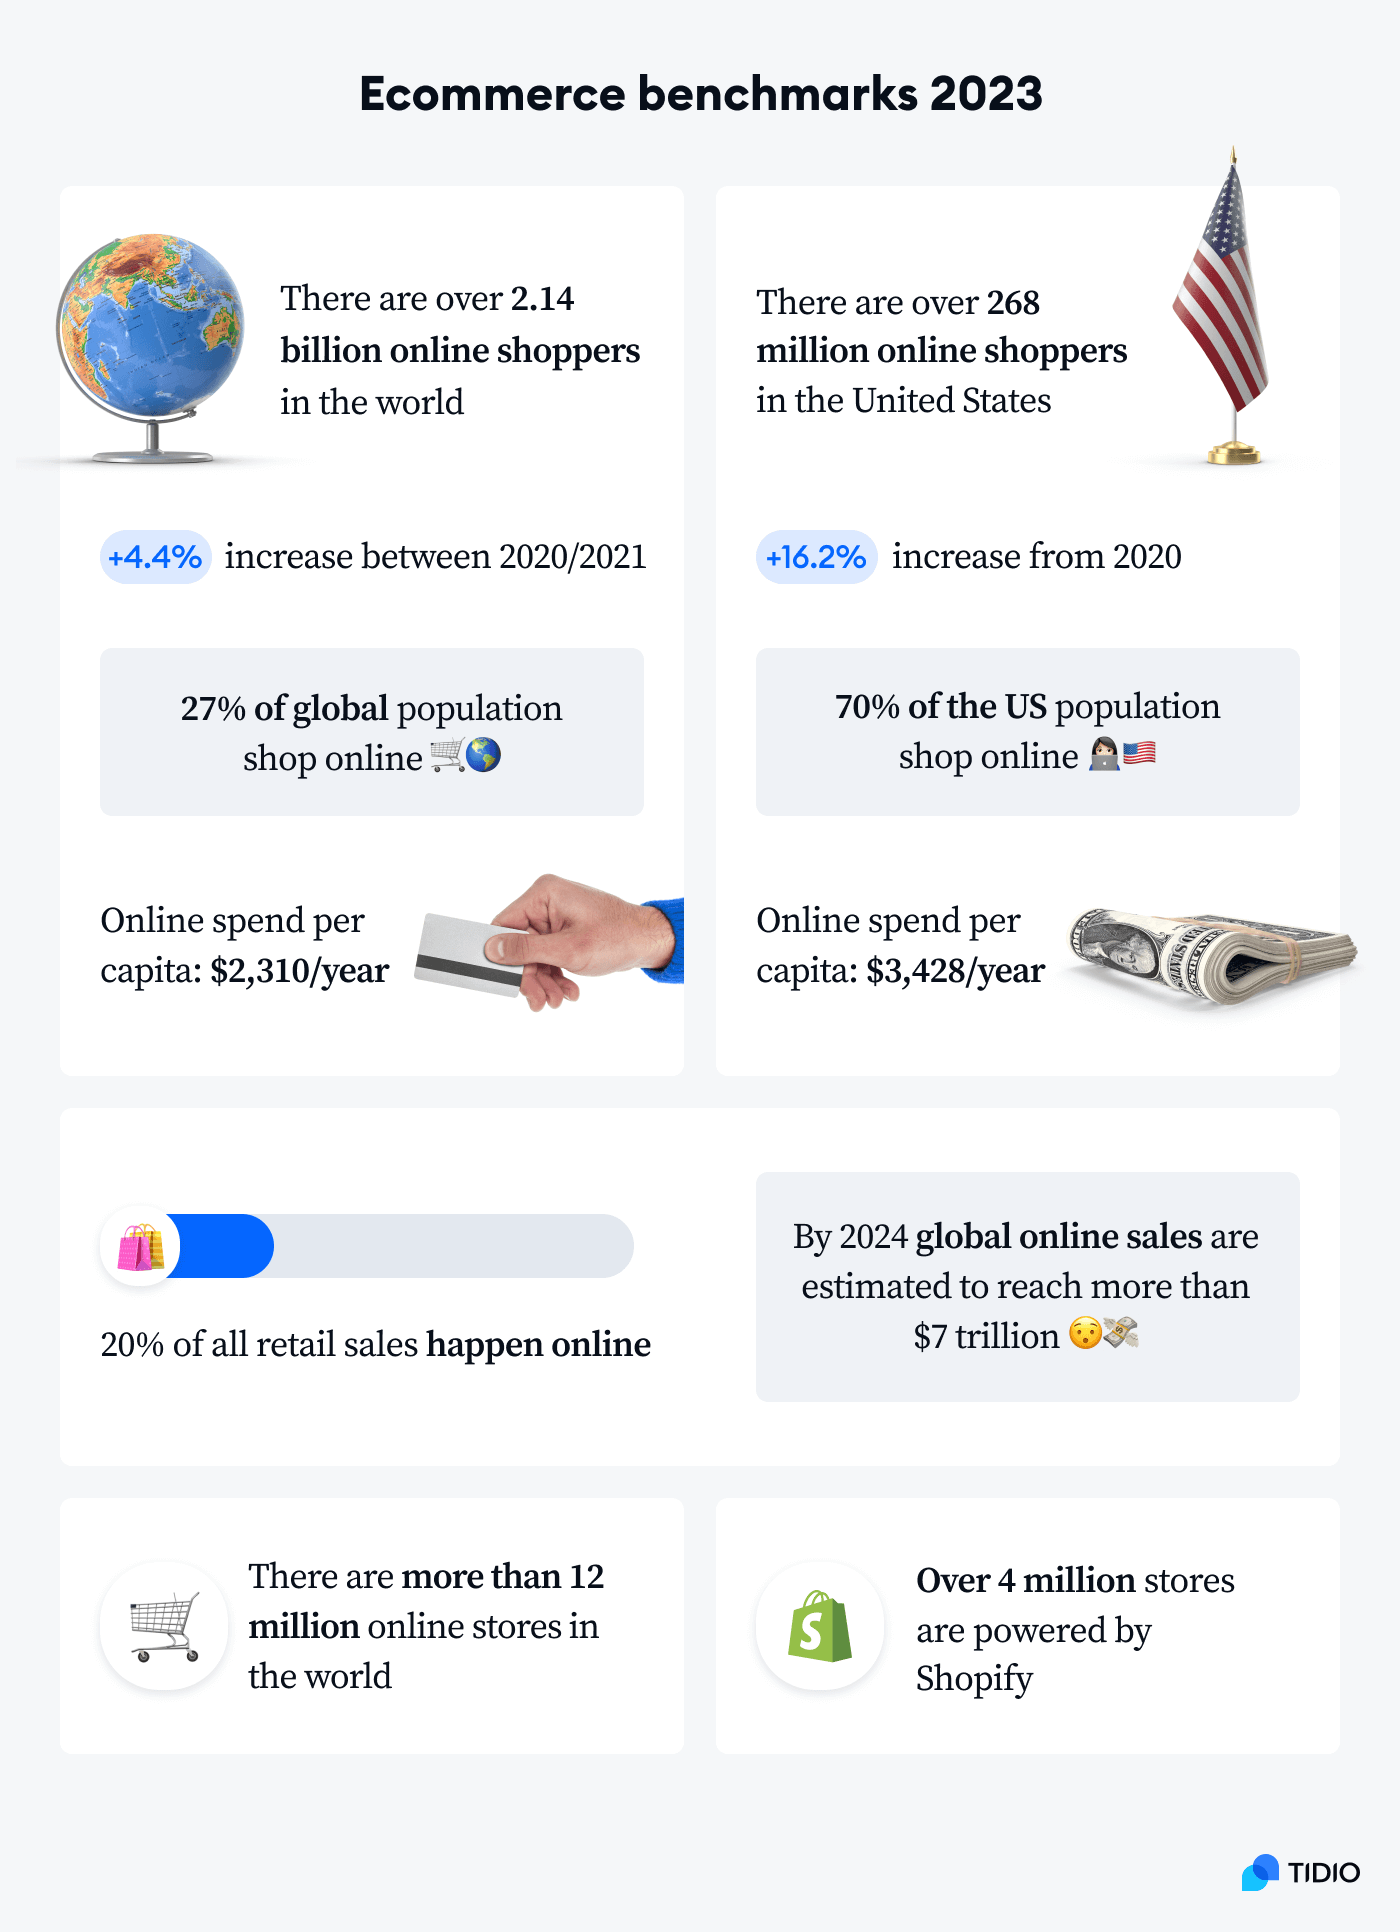
It’s visible that the ecommerce sector is becoming stronger year by year. However, what are some particularly interesting trends and changes when it comes to online shopping? Will 2023 bring any changes?
Read on to find out.
Is there an increase in online shopping?
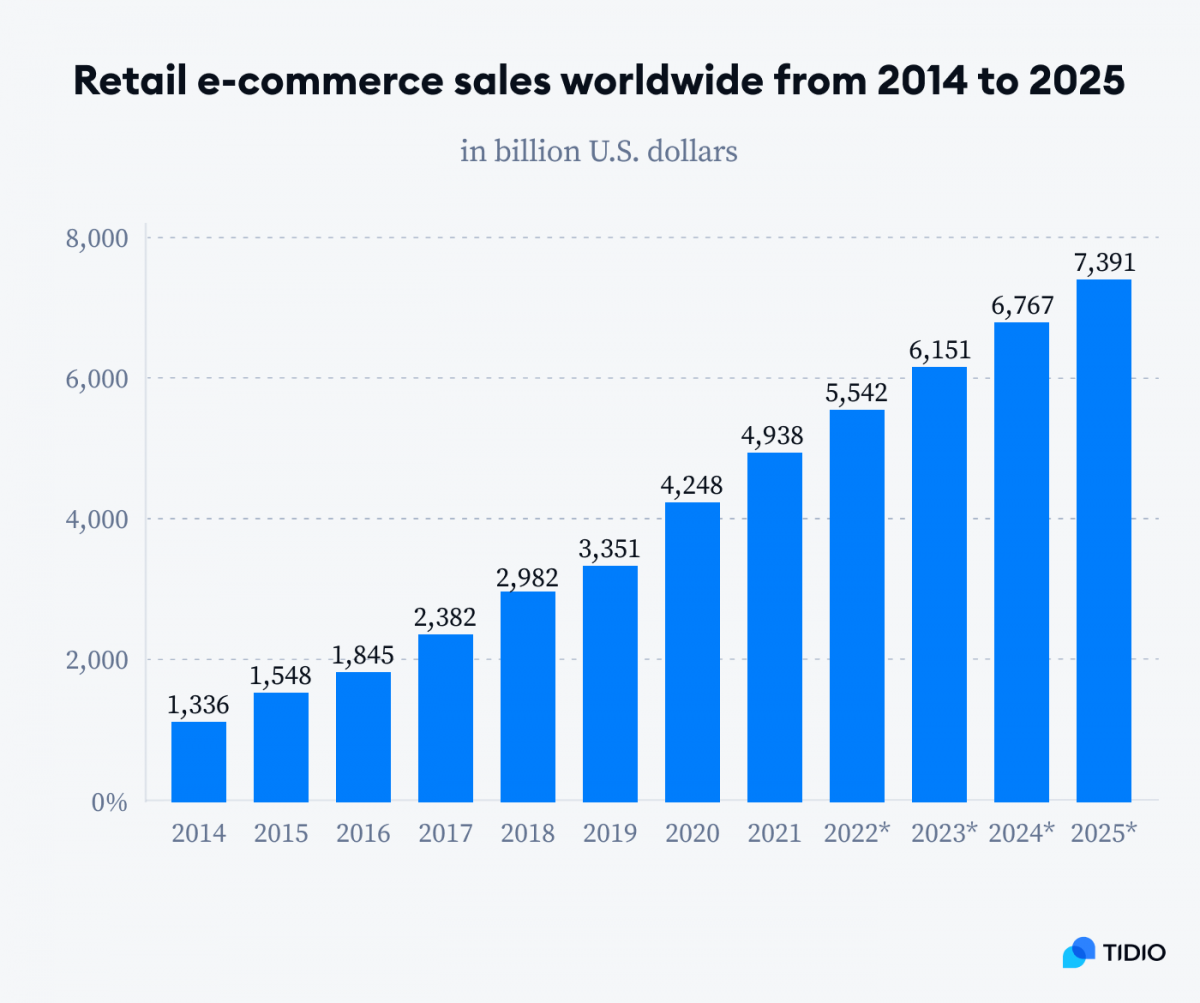
The number and value of online sales are on an upward trajectory. In fact, in 2024 global ecommerce sales will likely surpass $7 trillion in value. This growth is being fueled by a number of factors, including the rise of mobile shopping, the growth of social media, and the increasing popularity of subscription services.
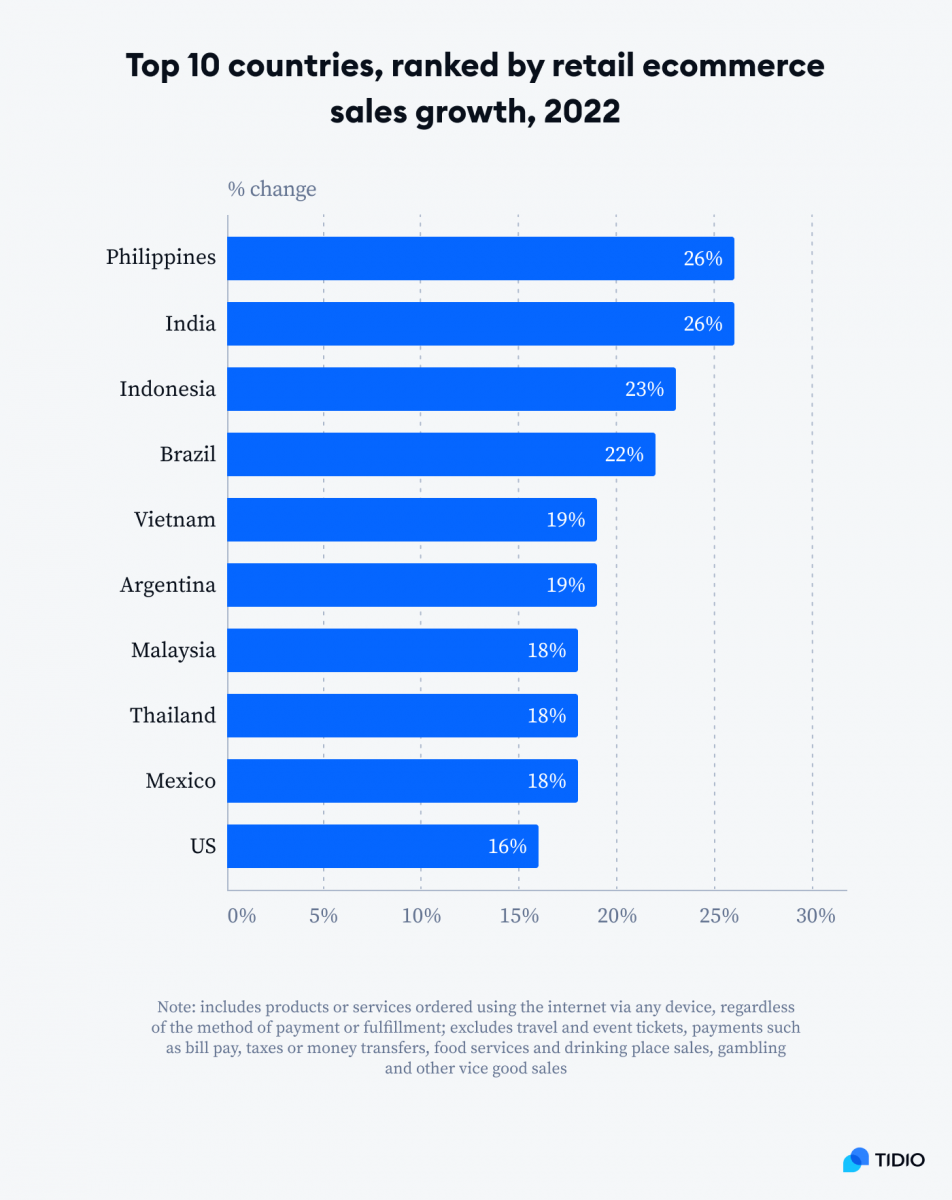
Countries in the Asia-Pacific region and South America are currently witnessing the fastest growth in the ecommerce sector. This is due to the dynamic adaptation of new technologies as well as the demographic structure of these countries – there are simply more younger people than older citizens. These new generations are more tech-savvy and are likely to buy things online than offline.
By comparison, the United States is already a mature market that has been using ecommerce solutions for many years. However, It’s worth noting that the US is still in the top ten fastest-growing countries when it comes to the increase in the number of online sales.
The US internet users are projected to make more online purchases in 2023 than ever before. And with this growth come new opportunities for businesses to capitalize on the trend by expanding their reach into the ecommerce market. However, businesses will have to use the right eCommerce fulfillment strategies if they plan to keep up with their competition.
How much has online shopping increased during the COVID-19 pandemic?
The pandemic has definitely had an impact on shopping behavior, with more people turning to the internet to buy everything from food and groceries to clothing and other essentials.
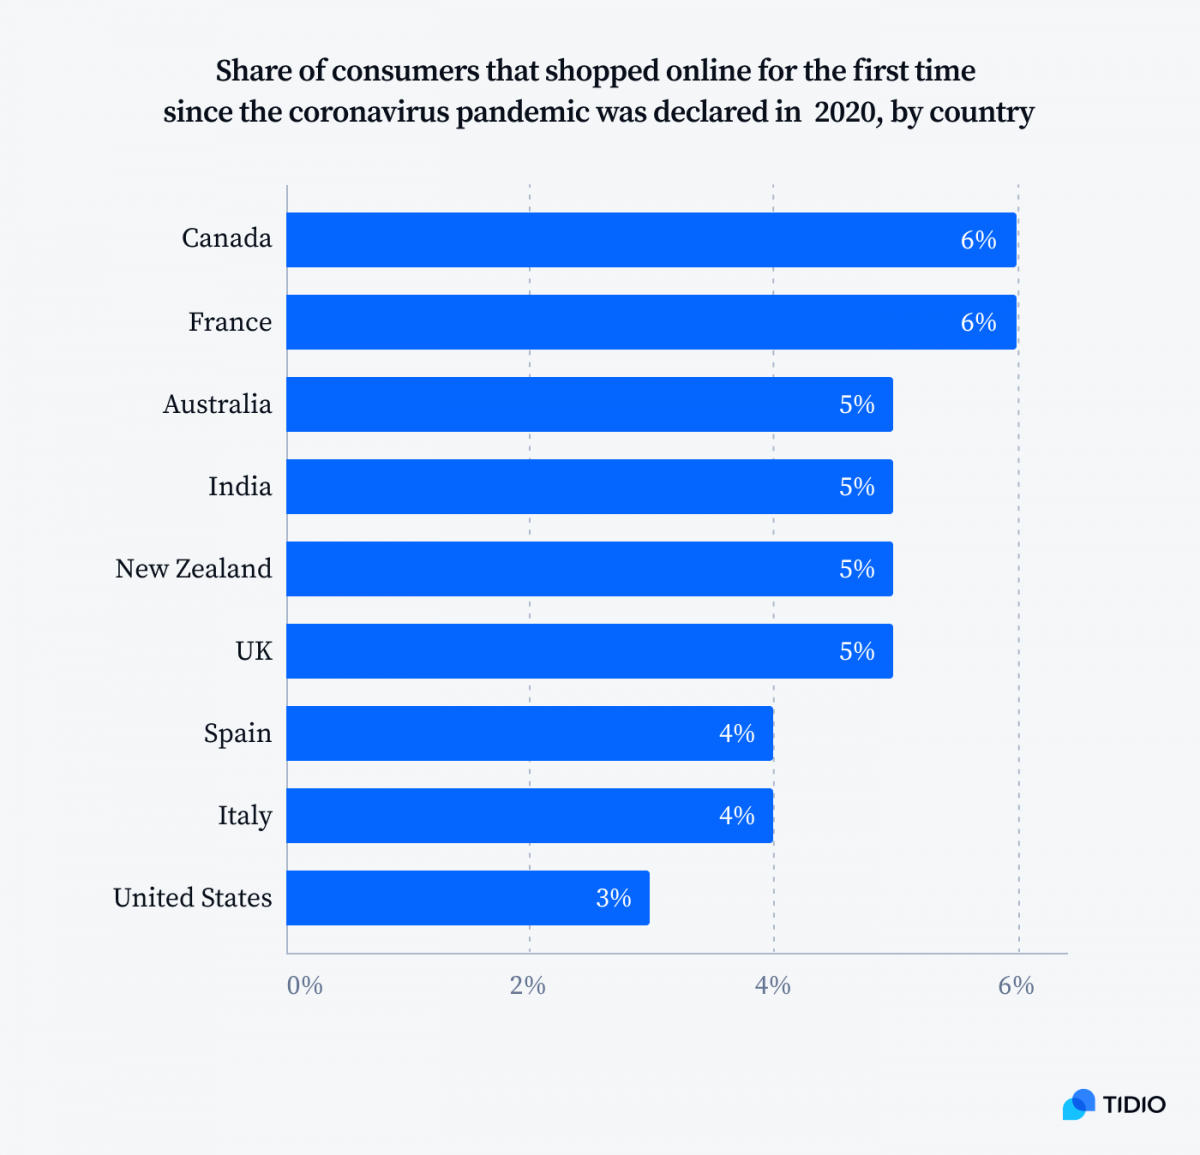
In fact, a recent study found that 3% of Americans have started their online shopping and bought something online for the first time as a direct result of COVID-19. This is likely because people felt safer buying goods on the internet rather than leaving the house to go to a physical store.
- The interest in online grocery shopping increased from 36% of Americans ordering groceries online before COVID-19 to 55% during the first months of the pandemic
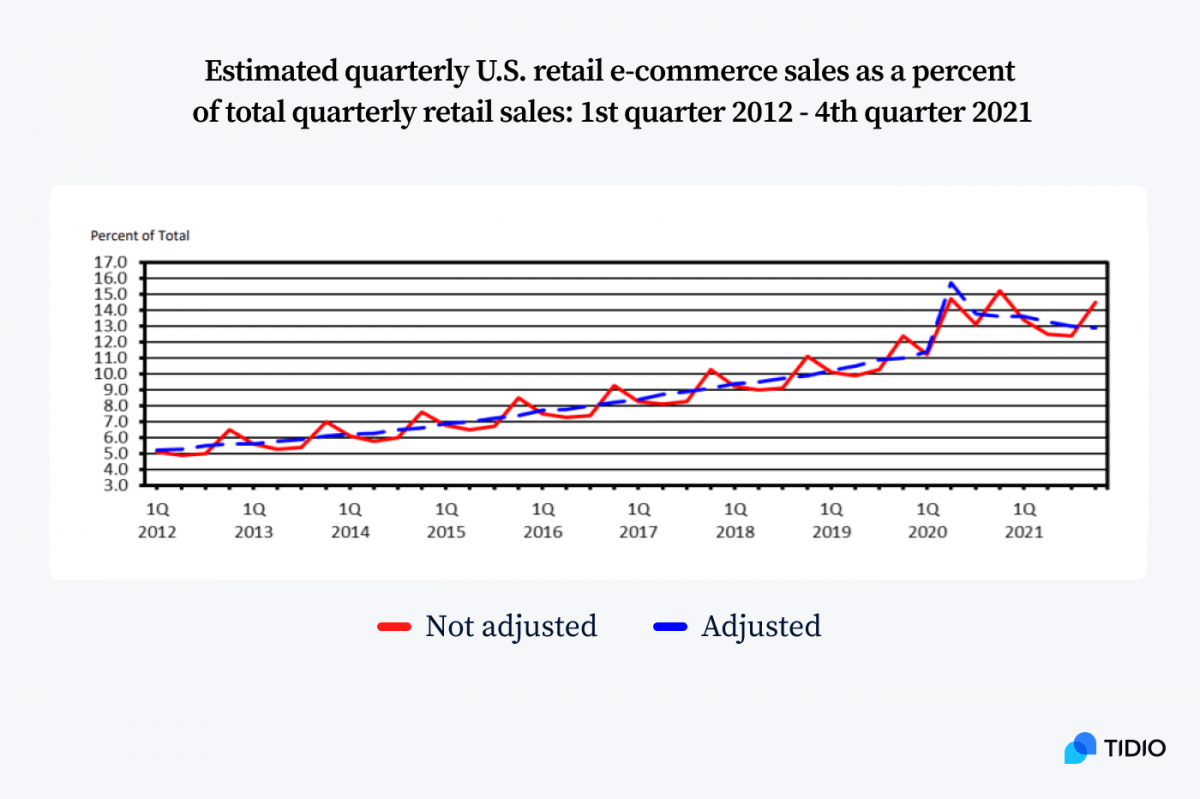
The impact of the pandemic, however, is best seen not by the number of new online shoppers but by the higher frequency of purchases by people who were already online consumers. Here, you can see a clear spike in the importance of ecommerce at the onset of the pandemic. The online shopping growth expressed as a percentage of all sales shows a real paradigm shift that happened in 2020.
Global ecommerce industry
You probably already know that there is more demand for online stores than ever before. But what are some other reasons for the growth of the online retail sector?
Well—
For a start, ecommerce stores are cheaper and easier to maintain than traditional brick-and-mortar stores. And there are more ecommerce platforms and tools available to help small businesses get started. Nowadays, anyone can set up a store on Shopify and create a customer service chatbot for free to get hundreds of new online consumers.
How many ecommerce sites are there
According to estimations, there are currently between 12 and 24 million online retailers in the world. Some are popping up every day, some are closing down, but the growth is pretty steady. Incidentally, the majority of online stores are powered by Woocommerce or Shopify.
These numbers may seem overwhelmingly high, but people are willing to spend more and more money online. It’s a real gold rush for online business owners. Moreover, ecommerce market will continue to grow almost exponentially in the next few years.
It’s predicted that global ecommerce sales are going to double before the end of this decade.
The biggest rise in interest when it comes to starting online businesses happened in 2020 together with the immense increase in online shopping. Interestingly, in 2021, it fell back down.
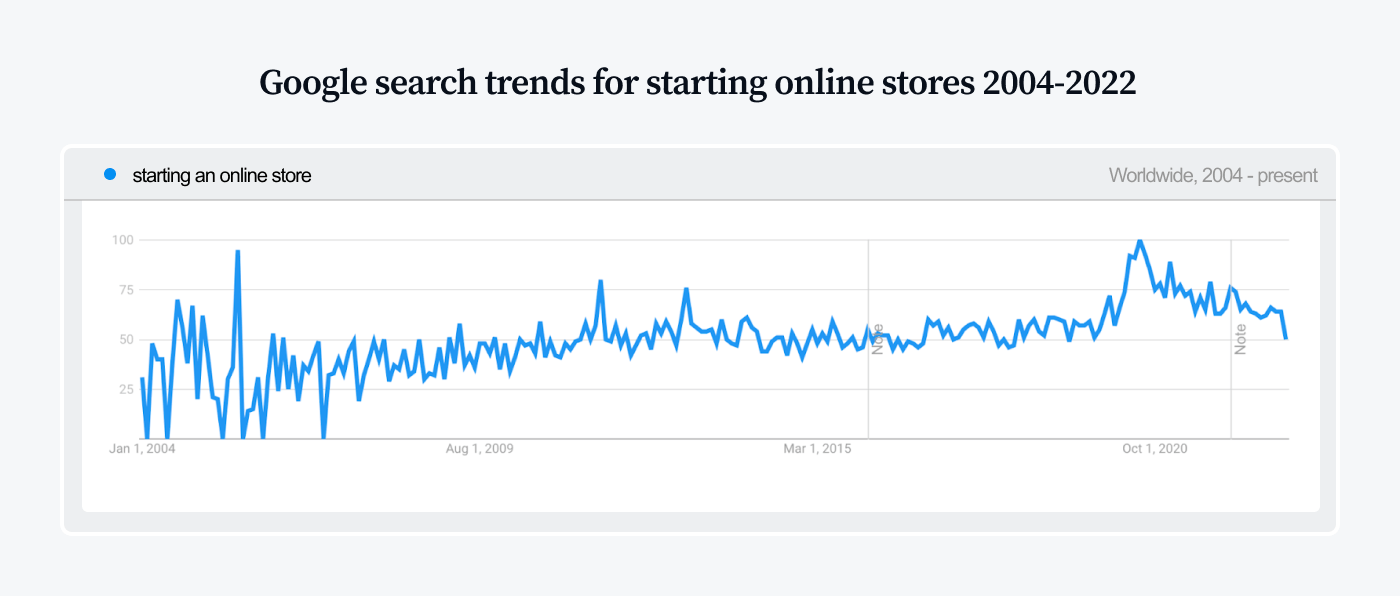
Currently, on the side of business owners, the number of online stores is still too low to meet the growing demand. But, apparently, there is no significant spike in interest at the moment. In 2023, you still have a chance to jump on the bandwagon and ride the wave of ecommerce revenue.
See how to recreate in-store experience online with the latest AI technology
Online shopping vs in-store shopping statistics
Online shopping has been around since 1995, but it wasn’t until recent years that the number of digital shoppers exceeded those who shopped exclusively at physical stores.
Ecommerce, in its current form, is not intended to completely replace in-store shopping. Some retailers are even moving towards a model where you can try things in-store and then get the same product shipped to you.
It makes perfect sense, as certain products are more convenient to buy in person and others through a website or app. For example, buying a car on Amazon is a bad idea. A book, on the other hand, is a pretty safe bet.
Most customers embrace both ways of shopping. In the US, the number of customers who didn’t buy anything on the internet decreased to 30%. But digital buyers don’t stop visiting traditional stores—they shop both online and in-store.
Nevertheless, ecommerce sales make up a growing share of retail. As recently as 2017, online sales accounted for just 1/10th of all worldwide sales. By 2025, they are expected to represent almost 25% of total retail sales.
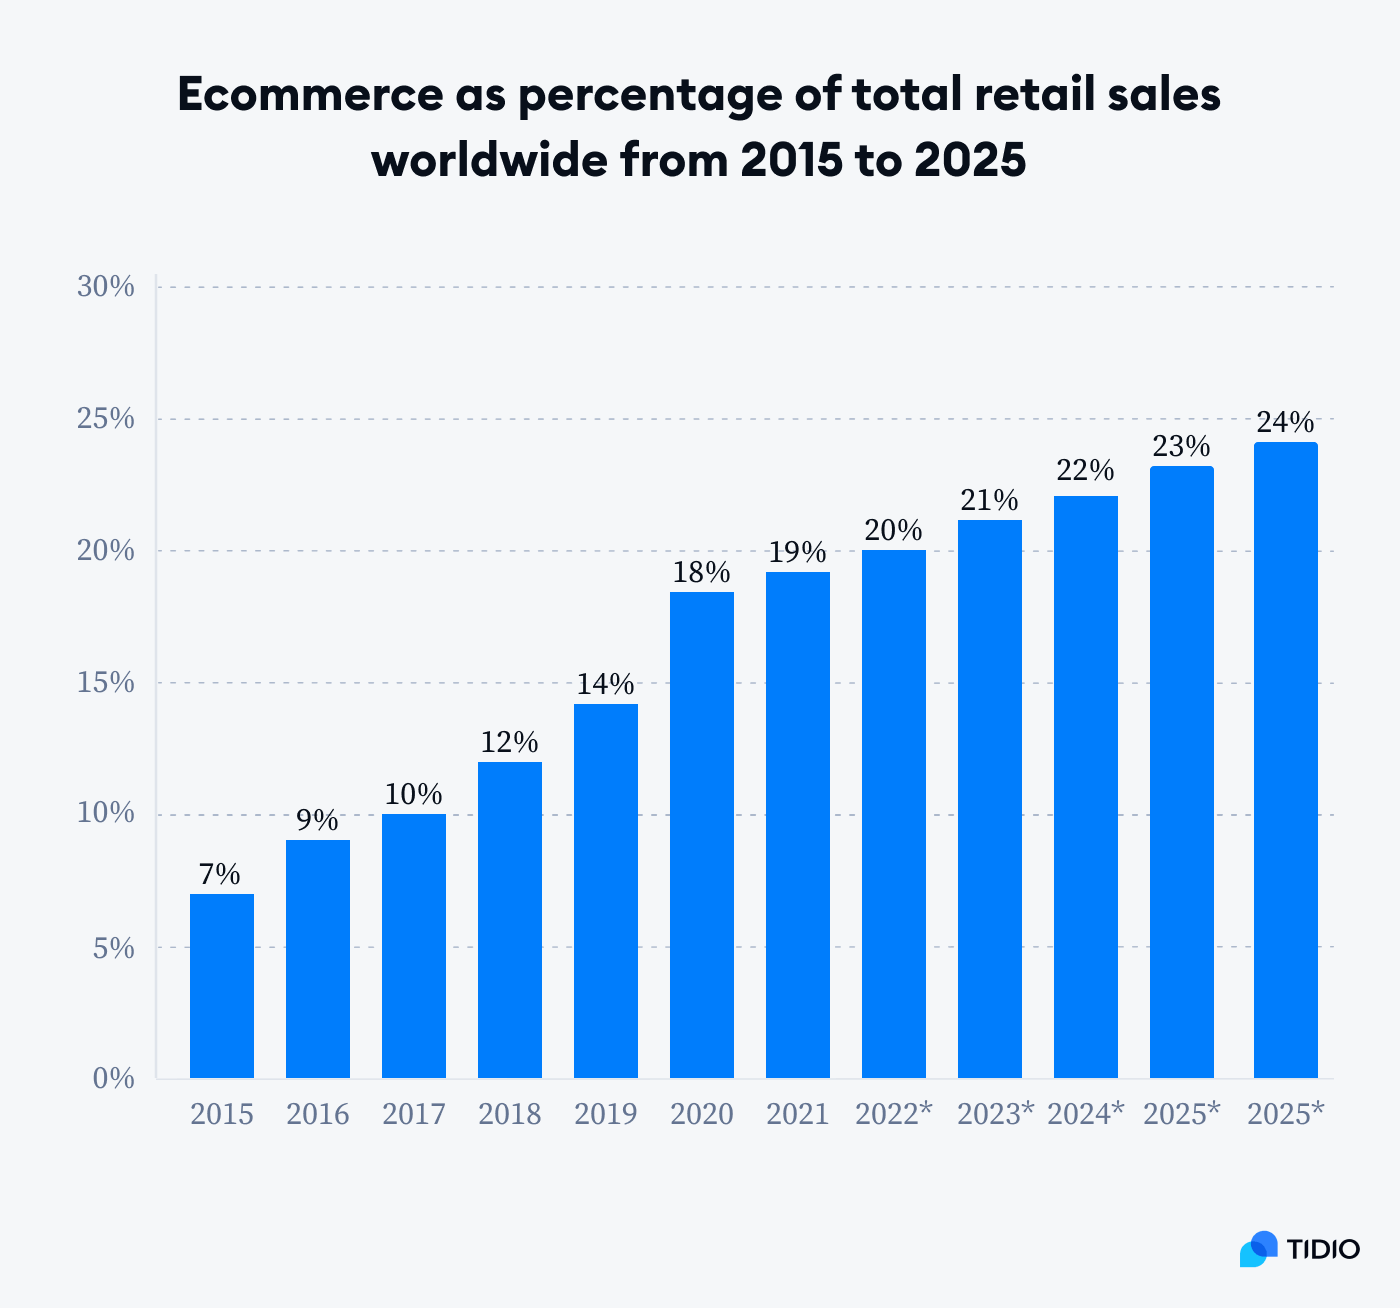
- Currently, about 20% of all retail sales happen online
- The number of brick-and-mortar retail stores in the US is declining, but the total sales volumes at physical stores are still increasing
- The annual growth rate for in-store sales is about 4% while for ecommerce sales it’s almost 13%
- The most popular advertising channels for online stores are Google Shopping, Facebook Ads, Amazon, and Google Search
The number of brick-and-mortar retail stores in the US fell from over 450,000 to just under 350,000 in 2021. The year 2022 brought a tiny increase of 2%. Still, the future doesn’t look bright for brick-and-mortar stores. With the ease and convenience of online shopping, their numbers are expected to continue on a downward trend as ecommerce takes on an even greater role in consumer purchase decisions.
Even when shopping offline, 28% of US consumers use their phones to browse discounts, compare prices, and read reviews.
Consumers love the idea of shopping from their own homes. About 81% of people conduct research online before making a purchase. Interestingly, fast and free delivery are the primary factors when choosing where to buy.
One of the most notable changes is how younger generations are driving up ecommerce sales, especially with mobile devices. Shoppers are increasingly using smartphones to make purchases via shopping apps.
But, the average value of US online shopping orders is still generally higher on desktop than mobile devices. In the second quarter of 2022, online purchases made from a computer had an average value of $155,75, while mobile orders averaged at just over $112.
Read more: Mobile Commerce Statistics
How many people shop online
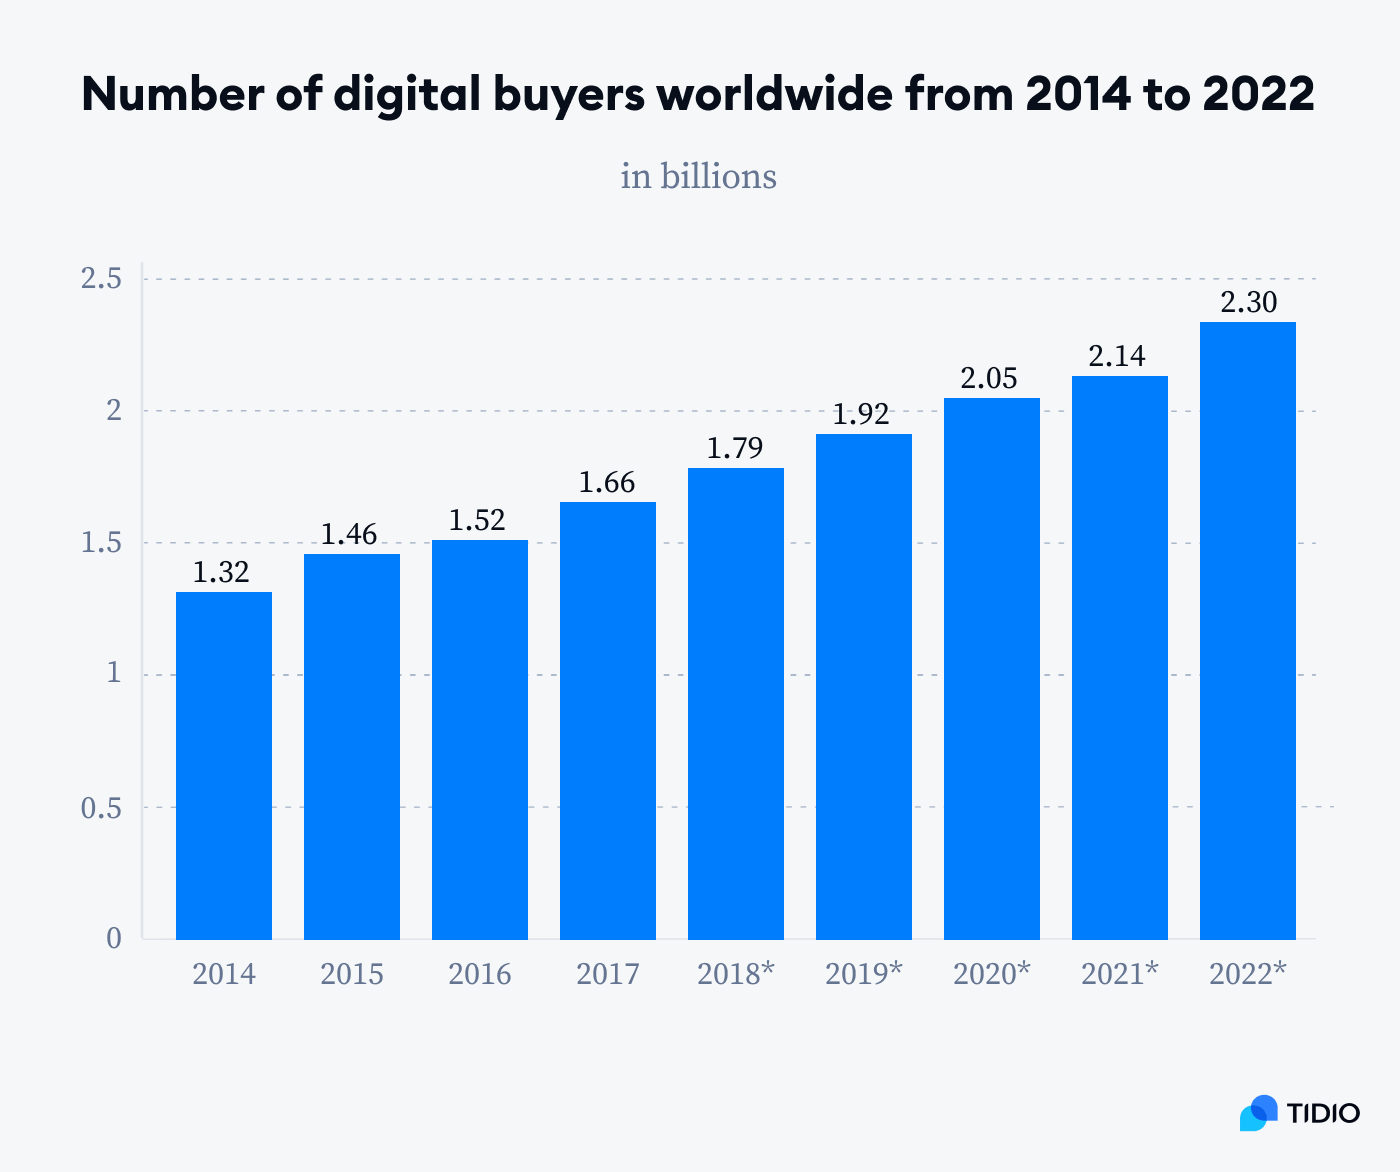
Over 2.14 billion shoppers now buy items online, which is a significant increase from just a few years ago. With the current world population of 7.9 billion, it means that 27% of all people that are alive are digital buyers.
- In 2022 alone, over 2.3 billion consumers made at least one purchase from an online retailer
- Over the past 5 years, the number of digital shoppers has increased by 40%
- During the same period, the sales volumes increased by 218%
- In 2015, an average customer spend was about $1,060 on online purchases globally—in 2021, the average online purchase value increased to $2,310
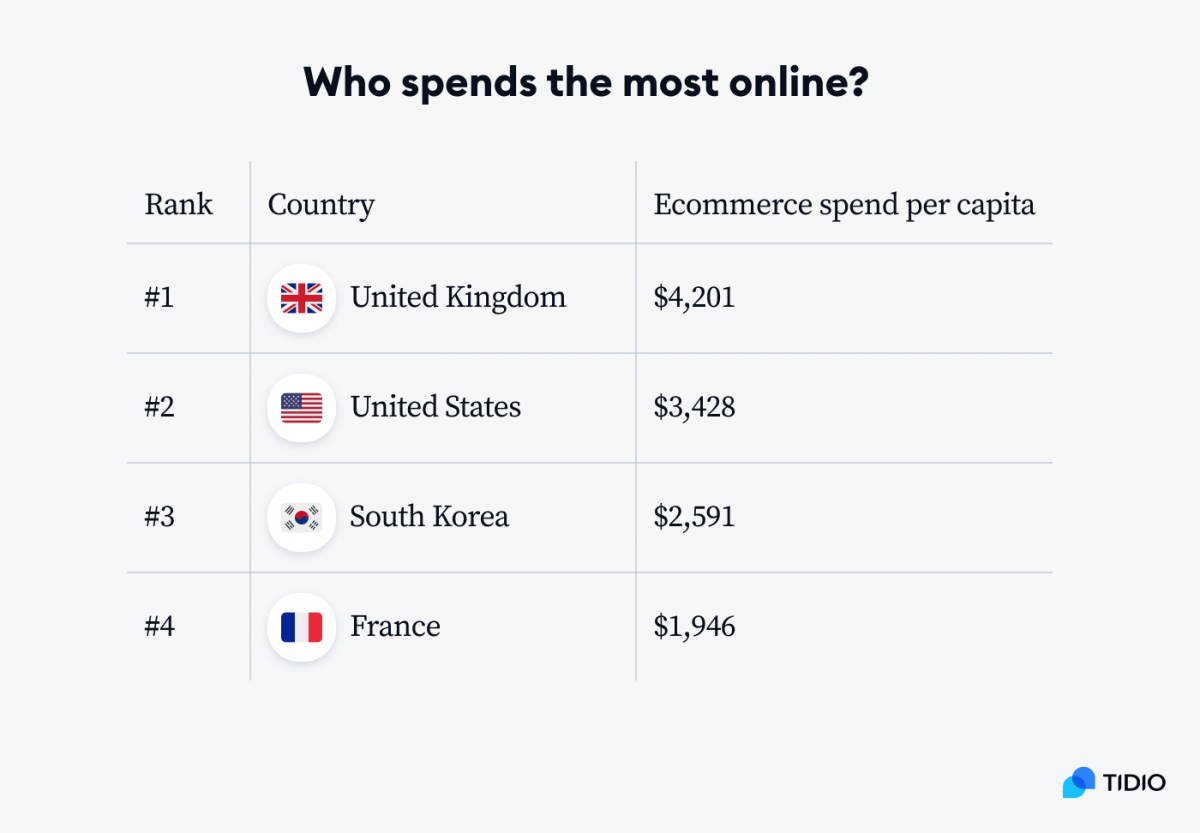
- In some countries, these numbers are much higher, with the United Kingdom digital shoppers spending over $4,200 per year on average
Not only is the number of shoppers increasing, but so is the frequency with which people shop online. One of the main factors driving such massive increases is the smartphone penetration among Chinese consumers. There are currently 1 billion active smart devices and mobile phones in China with over 600 million used by consumers on a daily basis. Additionally, the ecommerce industry in countries, such as the United States, is continuing to grow at a steady pace.
Interestingly, only under 2% of ecommerce website visits convert into a purchase, and 80% of shopping carts are abandoned. With the ever-increasing competition in ecommerce, it’s vital to closely monitor conversion rates and optimize the checkout process in order to not fall victim to these numbers.
Read more: Take a look at the latest shopping cart statistics and trends.
How many Americans shop online
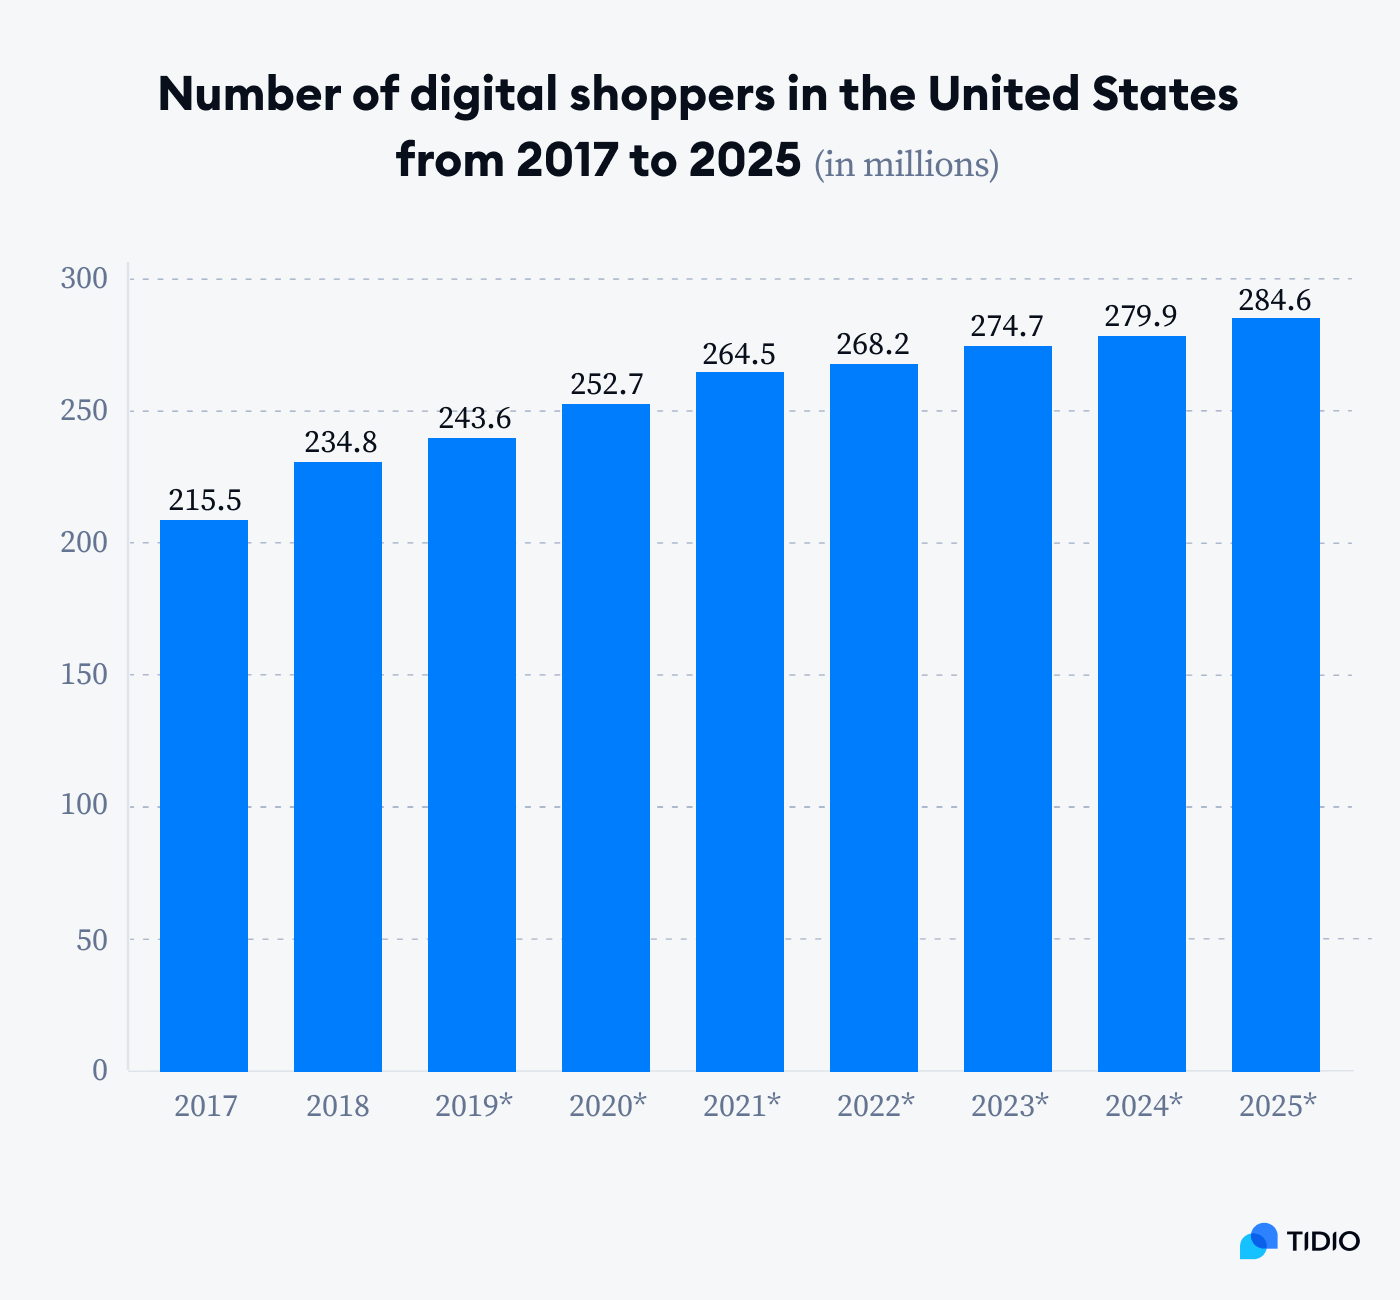
Right now, 70% of Americans are shopping online. In 2022 alone, there were a total of 268 million digital buyers in the United States and by 2025, this number is likely to reach 285 million.
Their purchases represent about 18% of the global ecommerce. This leads to great earnings for the US ecommerce industry. For instance, total ecommerce sales for 2022 in the US were estimated at a whopping $905 billion.
Holiday season in the US
The most important shopping period in the states is the time before the holidays. The year 2017 was the first time when the number of Americans buying gifts online caught up with those who buy them in stores. In 2021, the number of people who bought gifts from online stores was even higher, with 57% choosing to buy Christmas presents online.
Demographics of online shoppers
The countries spending the most on online shopping are China, the United States, Japan, the United Kingdom, France, and Germany. These countries account for more than half of global ecommerce spending.
If you are interested in what age group spends the most money online, the answer is Generation X. People born between the late 60s and early 80s are the most important consumer segment when we compare their shopping habits and spending power to other generations.
Gen X online buyers are still the most relevant customer group when it comes to the ecommerce sector. They make regular online purchases and have the highest average yearly expenditure (almost $70,000) of any generation. While their total cumulative spending power is lower than that of Baby Boomers, they are making up for it by shopping online more often.
Demographics of online shoppers
Gen X online buyers are still the most relevant customer group when it comes to the ecommerce sector. They make regular online purchases and have the highest average yearly expenditure (almost $70,000) of any generation. While their total cumulative spending power is lower than that of Baby Boomers, they are making up for it by shopping online more often.
What percentage of shopping is done online (by generation)
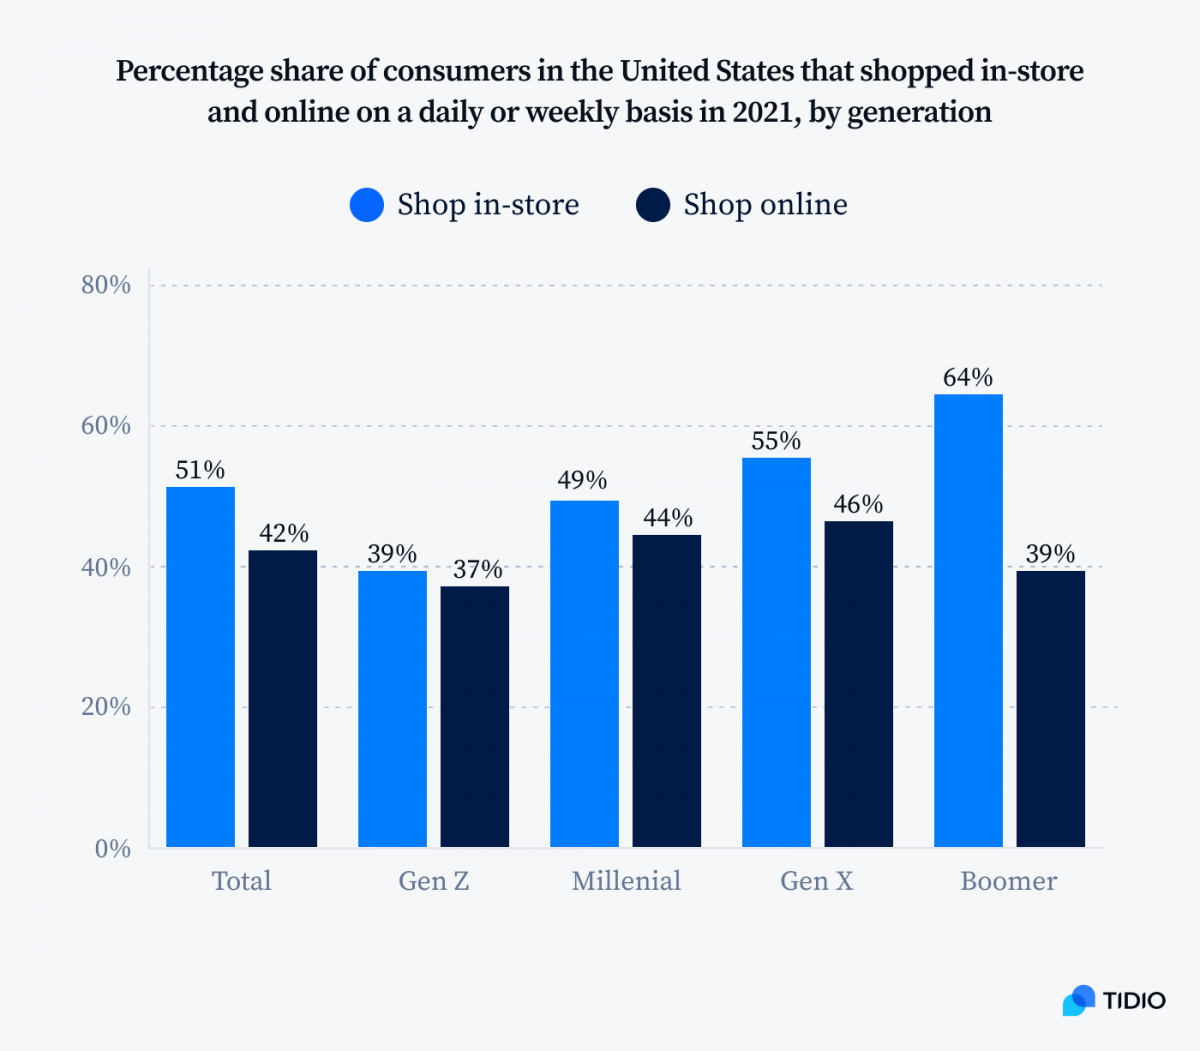
It’s quite logical that different generations have different shopping habits, both online and offline. However, there are some interesting traits unique to every generation and their spending patterns online.
- About 38% of consumers are afraid they’ll overspend when using credit cards—that’s why Gen Z and Millennials prefer shopping with debit cards, while older generations favor credit cards or cash-on-delivery payment options
- More than 35% of Millennials admit to being heavily influenced by social media when making a purchase decision—this digital marketing channel is the most effective for people between the ages of 26 and 42
According to our research, about 45% of Gen Z customers cross-reference prices in multiple online outlets to find the best deal. Gen X and Baby Boomers are less likely to browse multiple online stores than younger generations. It can be linked to the fact that they have more disposable income and can afford to make purchases without hunting for bargains.
At the same time, Millennials have the highest adoption rate when we look at social shopping. Around 60% of people between the ages of 25 and 41 have already made a purchase on social media.
Social commerce, being the integration of ecommerce and social media, is expected to grow exponentially in the coming years. In 2022, it generated around $724 billion, which is predicted to increase to $1,238 billion by 2024.
Male vs female shopping statistics
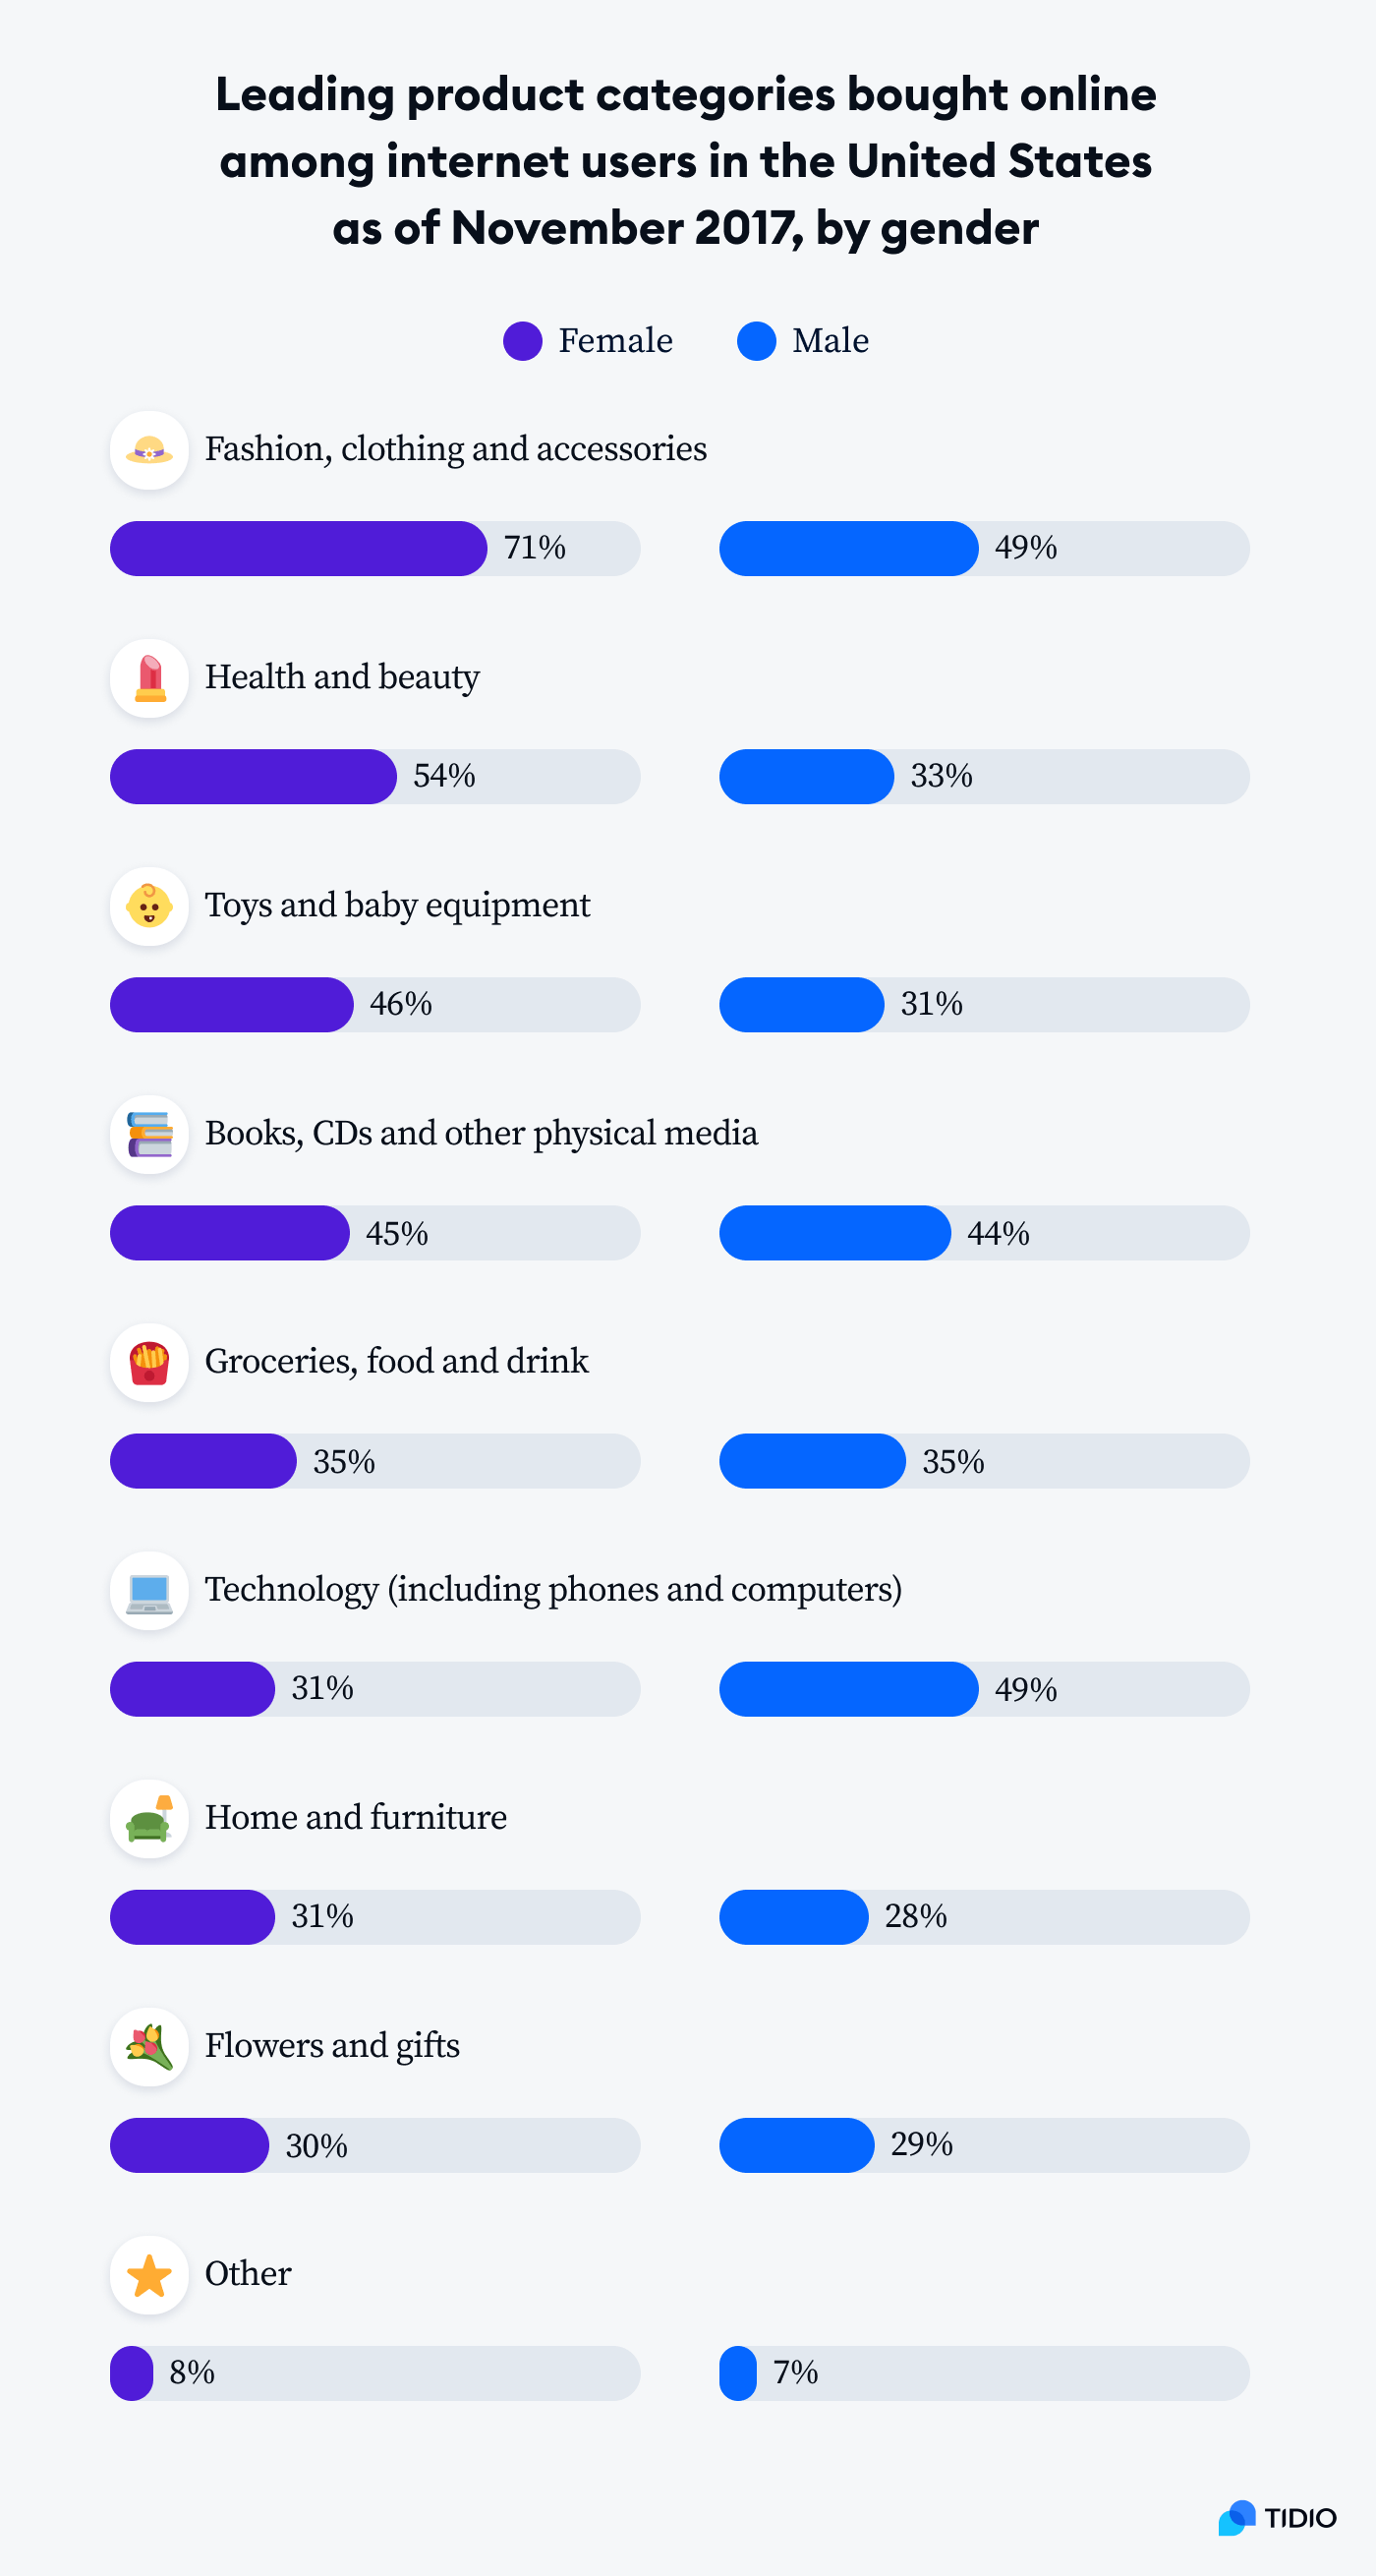
Gender is another important factor that is correlated with buying behaviors. This is most evident when we look at the categories of the most purchased products online. Women are primarily buying fashion and clothing (W 71% vs M 49%) while men are much more interested in new products related to technology (M 49% vs W 31%).
- Female online shoppers buy more often per year—on average 7 times per year, compared to men making online purchases about 5 times
- Although they buy things online less frequently, men spend on average $220 per transaction compared to only $151 per transaction for women shoppers
- Women make purchase decisions 7% faster than men, and many online retailers target women on social media with marketing campaigns that stimulate impulsive buying
Differences in the behavior of female and male consumers are often leveraged by online marketers. For example, reaching customers of a specific gender sometimes requires using completely different types of advertising appeals.
Read more on customer psychology: A Quick Guide to Consumer Behavior With Examples
What do people buy the most online?
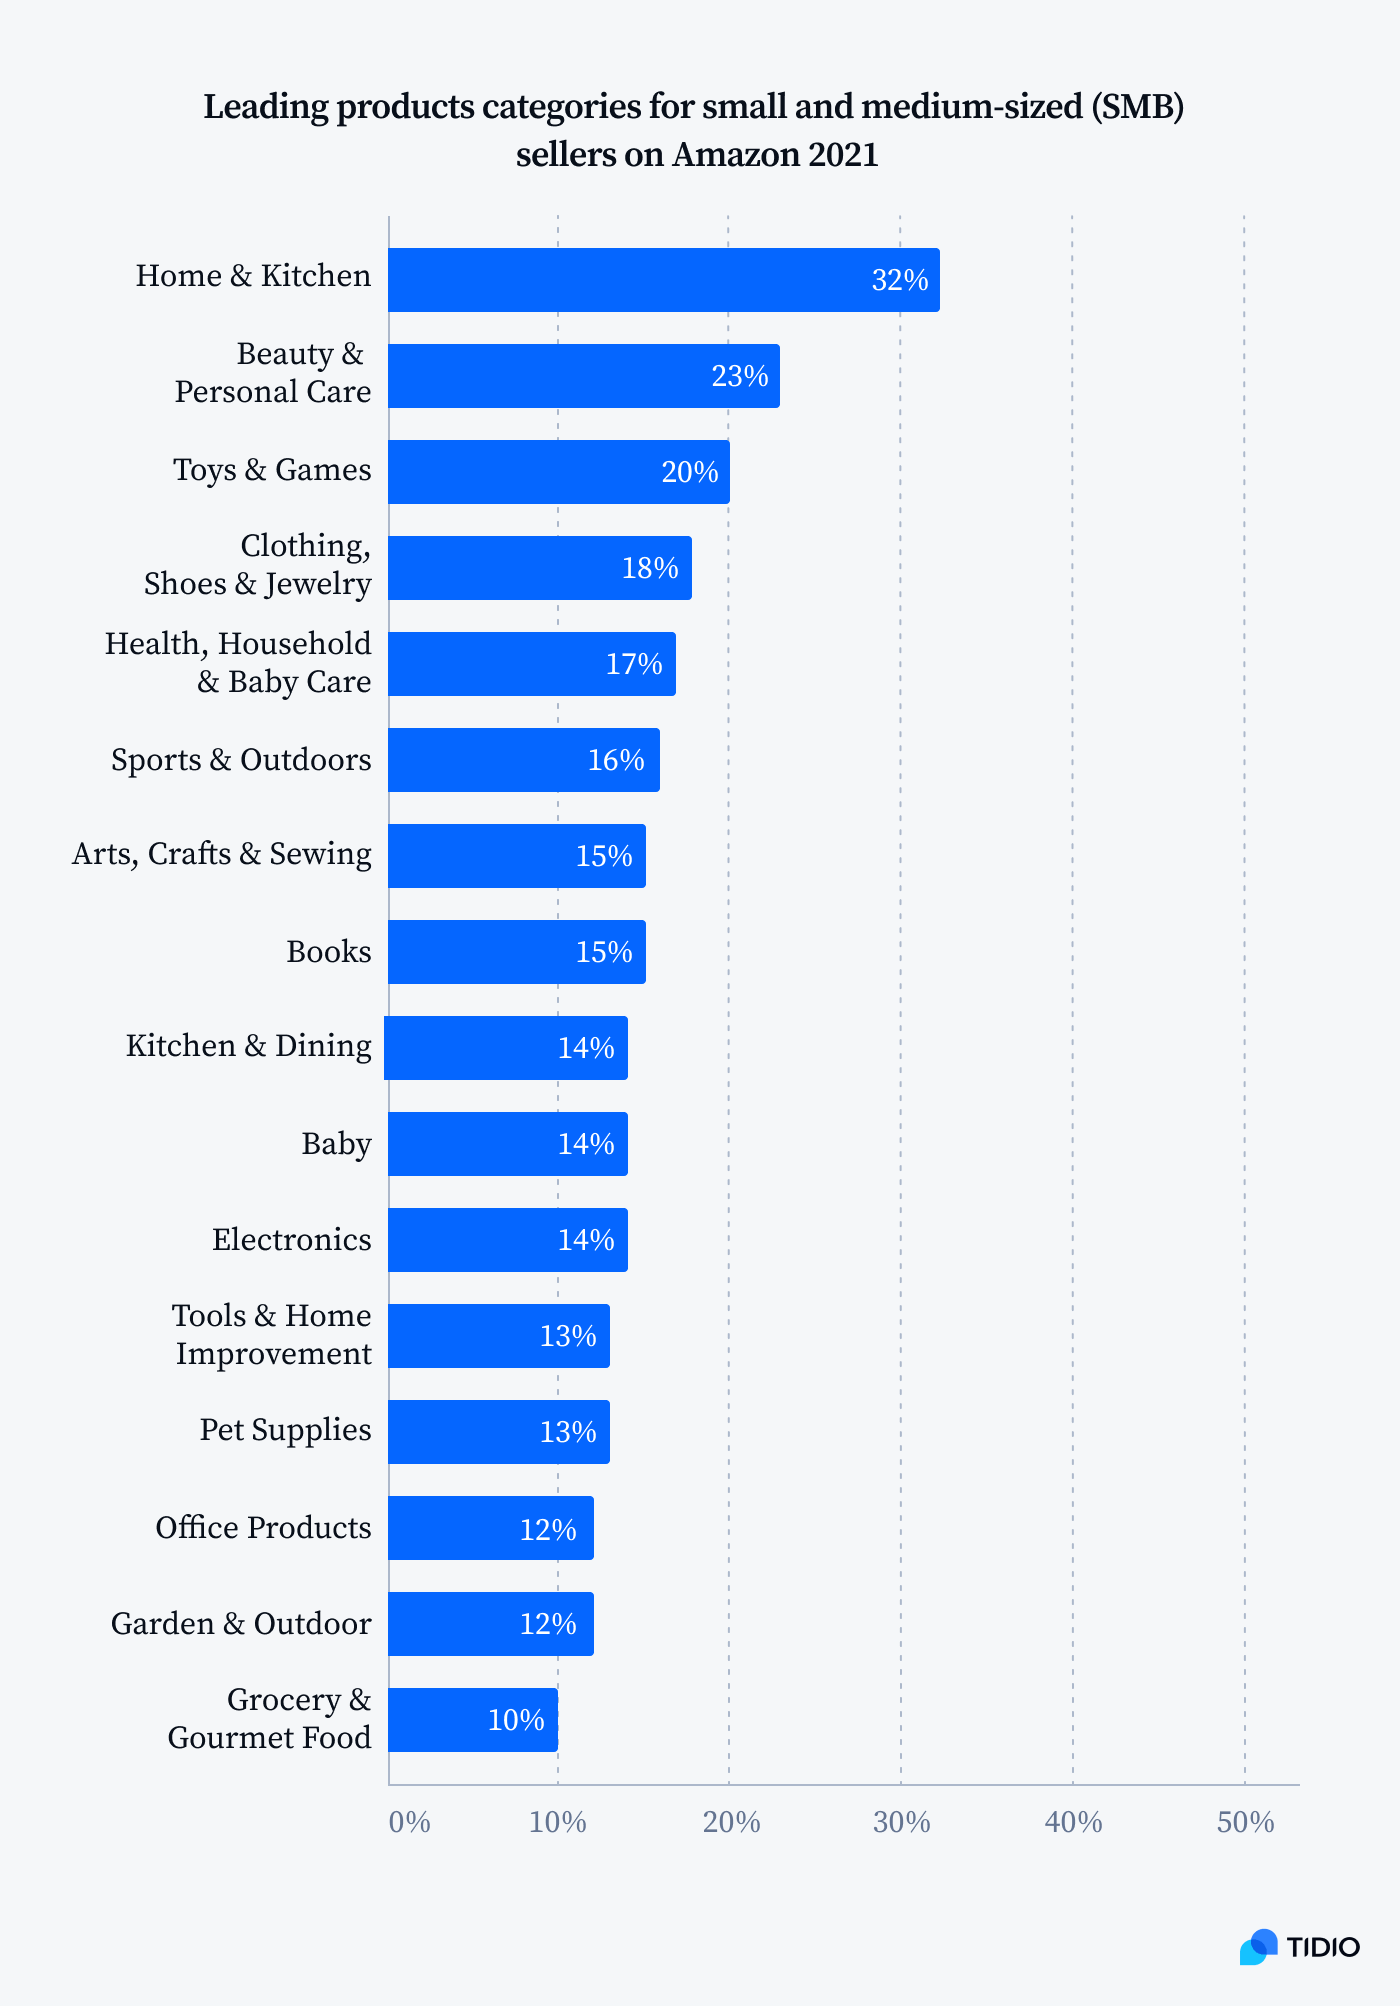
But first—which platforms are the most popular when it comes to online shopping? Amazon and eBay are among the largest online marketplaces, and they happen to also be a pretty accurate indicator of what sells best. Recently, the most popular product categories on Amazon were home and kitchen supplies, with 32% of customers, followed by beauty items, toys and games, and clothing.
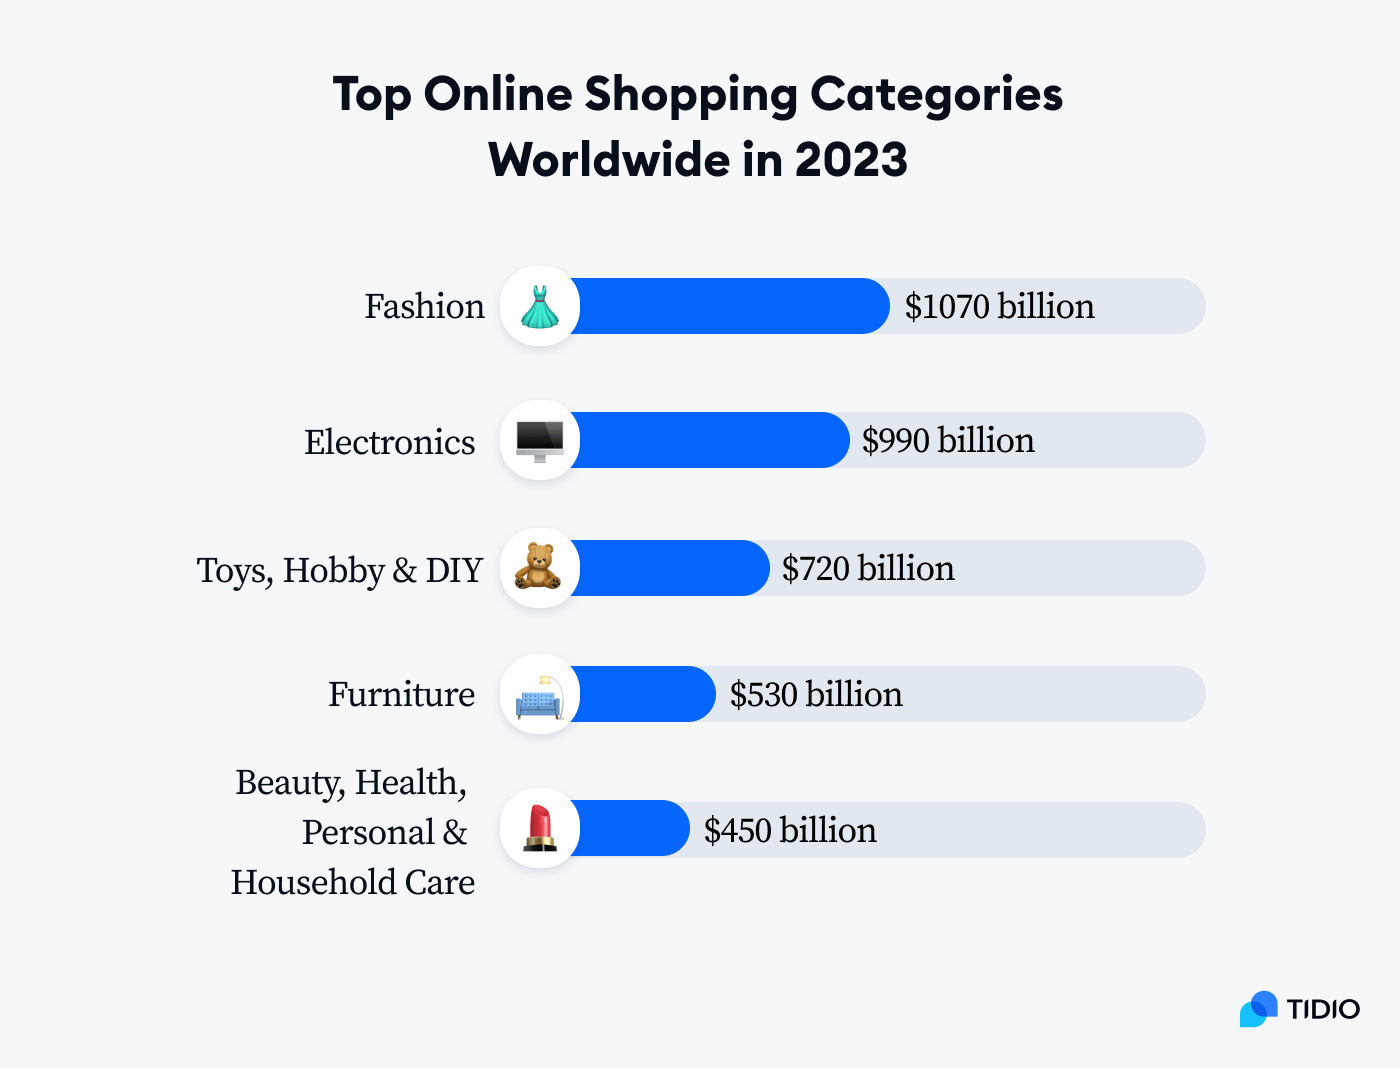
Interestingly, the fashion category gets ahead of everything else in the amount of money spent when we take all ecommerce sales globally and not just Amazon or eBay.
Choosing the right products matters a lot to businesses because each industry has completely different values related to shopping cart abandonment rates, conversion rates, or average order value. Remember that the best option is selling something that you like and would buy yourself, be that electronics, sneakers, or cat travel bags.
Read more: Best Items to Sell Online
Ecommerce statistics: conclusion
Businesses need to be prepared for a shift in how consumers shop, and they need to focus on creating an online presence that is both user-friendly and engaging. The ecommerce market size keeps growing at a very fast rate.
This trend is likely to continue in the coming years, as businesses find that it’s cheaper and easier to maintain an online store than a brick-and-mortar one. In addition, there are more platforms and tools available to help small businesses get started in ecommerce. As a business owner, it’s important to stay up-to-date on the latest shopping trends in order to capitalize on this growth.
If you are interested in more digital commerce statistics, you can also browse the original studies and reports below.
Sources:
- Future of Ecommerce: Shopify Report
- The World’s Biggest Online Spenders Revealed
- Retail Trade Sector: U.S. Bureau of Labor Statistics
- Quarterly Retail E-commerce Sales Q4 2021: US Department of Commerce
- How Does Online Spending Vary by Generation?
- Ecommerce: Men Spend More Than Women
- The Truth About Online Consumers: Global Online Consumer Report
- Preferred Payment Method for Online Shoppers
- How Consumer Payment Preferences Are Shaping Commerce
- Distribution of Digital Buyers in the United States: Statista
- COVID19, Online Grocery, and Huge Revenue for Amazon
- The 2022 Breakdown of the Ecommerce Industry World
- Americans Will Spend an Average of $998 on Holiday Shopping This Year
- Will This Holiday Sparkle? Consumers Are Ready to Bring the Shine
- The 2019 Amazon Consumer Behavior Report
- Shopify Revenue and Merchant Statistics in 2022
- Estimated value of the in-store and e-commerce retail sales worldwide from 2021 and 2025
- Social commerce revenue worldwide from 2022 to 2030
- Average value of online shopping orders in the United States from 2nd quarter 2020 to 2nd quarter 2022, by device
- Retail e-commerce sales worldwide from 2014 to 2026
- The Data Point: 28% of US Consumers Used a Mobile Phone During Their Last Store Trip
- Study: 81% research online before making big purchases
- Average ecommerce conversion rate
- Shopping cart abandonment rates
- Feed Marketing Report

